During the Great Recession, home builders cut production sharply as did the firms that produce the materials used to construct homes. Now that the housing market is recovering, tight supplies are driving prices up. This upward trend should be temporary, lasting only as long as it take for suppliers to get back up to speed.
Oct 8, 2013
Building Blocks
Construction Costs and the Housing Industry
Prices for some home construction materials and supplies are higher now, primarily because production slowed during the Great Recession. But as the housing market continues to recover, building materials should be in greater supply, driving prices down.

New home sales began rebounding in 2011 as U.S. and Texas residential construction emerged from the deepest downturn in recent history. But new residential construction did not begin immediately. Home builders who had cut production sharply during the Great Recession needed time to adjust to renewed demand.
Increased demand for home construction inputs, such as softwood lumber and drywall, has put pressure on supply chains for building materials and skilled workers, causing prices to increase and squeezing the margins for home builders (Figure 1). This is especially true if construction costs rise at a faster rate than house prices. A steep rise in construction costs could hinder the housing recovery.

Not all construction inputs have gone up in price, so while overall construction costs are increasing, they are not doing so at an exponential rate. When output and supply are restored, especially for wood and lumber, prices are expected to register a more moderate growth rate. Price increases in 2012 and 2013 are likely a temporary effect caused by tighter supplies during the Great Recession, when a substantial number of mills closed. Labor compensation — wages and benefits — paid to construction employees are still below their pre-crisis levels and are not putting pressure on costs or home builders’ profit margins.
Construction Cost Breakdown
The National Association of Home Builders (NAHB) conducts a “construction cost survey” of builders on the components that make up the price of a typical single-family home. The survey is sent to a representative sample of home builders and is stratified by builder size and region of the country. In 2009, the survey methodology changed to provide a more representative sample of single-family home builders across the country, thus affecting the comparison with previous years.
In the 2011 survey, construction costs represented almost 60 percent of the final sales price of an average home (Table 1). This was a slight increase from the 2009 survey (Table 2). Total production cost fell from $222,511 in 2009 to $184,125 in 2011, mainly because of the smaller finished area — 2,311 square feet compared with 2,716 square feet.


The average estimated construction cost of the finished area of a single-family house fell to $80 per square foot in 2011 from $82 per square foot in 2009. As with any other manufactured goods, production costs are key in determining profit levels. Higher construction costs translate to lower profits for the home builder.
A construction cost breakdown for the 2011 survey (Table 3) shows that framing and trusses account for the largest share of construction costs (13.5 percent), followed by excavation, foundation and backfill (9.3 percent), plumbing (6 percent) and cabinets and countertops (5.6 percent). Heating, ventilation and air conditioning (HVAC), siding, tiles and carpet, electrical wiring and drywall each account for 4 to 5 percent of total construction costs.
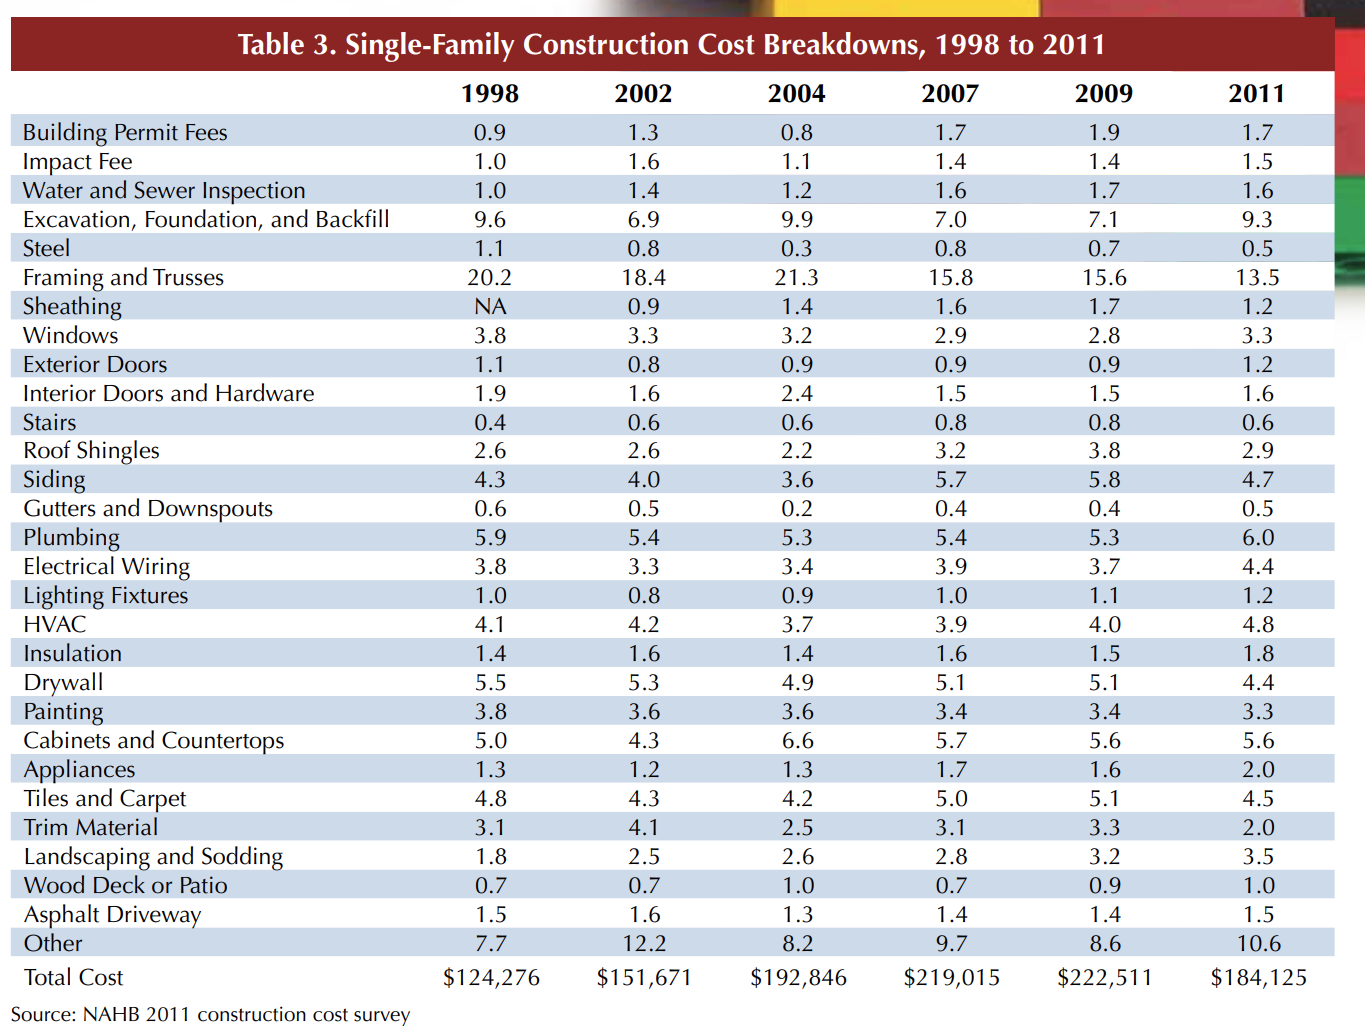
The second largest share of construction expenses are “other costs” (10.6 percent), which include construction clean up (such as dumpster and trash disposal), house cleaning, mirrors, glass and shower doors, fireplaces and bathroom accessories, and insurance and utilities. Fees paid by home builders to local governments, such as building permits, impact studies, and water and sewer inspections, total some 5 percent of construction costs.
The average price per square foot of framing and trusses for an average finished area in a new single family home was $11 in 2011 ($24,094/2,311 square feet) compared with $13 in 2009 ($34,805/2,716 square feet). If costs for all wood and lumber-related products (framing and trusses, interior and exterior doors, cabinets and countertops) were combined, they would account for approximately 22 percent of the construction cost.
Home building construction costs are highly influenced by the price of wood and lumber. If construction costs are increasing more than home prices, the home builder must absorb the cost through lower profit margins rather than increasing the selling price of the home. This scenario may lead to fewer new homes being built.
The survey showed an increase in the share of plumbing and electric wiring as a percentage of total construction costs from 9 percent in 2009 to 10.4 percent in 2011 (Table 3), primarily attributable to an increase in the price of copper. Historically, the share of both has fluctuated with the price of copper and copper products. In the case of electrical wiring, stricter electrical codes as local jurisdictions adopt new building codes is another cost factor. Increases in HVAC’s and insulation’s percentage of total cost from 5.5 percent in 2009 to 6.6 percent in 2011 (Table 3) is possibly the result of more energy efficient homes and significantly stricter building codes.
From the construction cost breakdown, it is clear these costs are related to a series of commodity and mineral prices from wood (framing and cabinets) to copper (plumbing and electrical wiring) to drywall and even petroleum (asphalt for paving and roofing). Construction costs are also influenced by price fluctuations in global commodity and mineral markets. In 2012, China’s increased demand for building supplies including wood and lumber put upward pressure on these inputs.
Recent Price Trends for Construction Inputs
Once the housing recovery gained momentum, prices of framing lumber increased steeply, starting in April 2012 and continuing through May 2013 (Figure 2). Price increases slowed as wood and lumber producers added back idled capacity. The producer price index (PPI) for softwood lumber and the random lengths framing lumber composite price from January 1995 to May 2013 show a strong correlation. A sharp increase from April 2012 to April 2013 brought prices back to their 2004 housing boom highs.

During this period, the average annual growth rates registered for the PPI and random lengths framing lumber composite price were 15.7 percent and 31.9 percent, respectively. Texas builders experienced similar price increases, with lumber prices in Dallas up 35.7 percent. These average annual growth rates are high compared with the average historical growth trend from January 1996 to May 2013 of 1.1 percent PPI for softwood lumber, 2.5 percent for the random lengths composite price, and 2.9 percent for the random lengths Dallas price.
Price increases for oriented strandboard (OSB) or “particle board” are even more dramatic. PPI and random lengths Southwest OSB prices, which include Texas data, registered average annual increases (April 2012 to April 2013) of 51.7 percent and 70.5 percent, respectively (Figure 3). From January 1996 to May 2012, these values were 8.6 percent and 9.3 percent, respectively.


Prices for drywall increased substantially from the beginning of 2012 through 2013 (Figure 4). The PPI for drywall increased on average 18.2 percent annually for that period, compared with a historical annual growth rate of 3.5 percent from January 1996 to May 2013. These price increases are still below the housing boom peak.
Prices of other home-building inputs registered a more moderate annual average growth rate from January 2012 to May 2013 (Table 4).


Labor is another key input in home building. Compensation is a significant part of the total cost of housing production. An increase in the compensation rate leads to an accelerated increase in construction costs unless it is offset by greater productivity growth. Given that housing prices are increasing steadily, home builders cannot add those construction cost increases into the price of a new single-family home without putting a squeeze on their profits.
Hourly earnings (wages and benefits) for construction employees at the national level actually declined 0.5 percent in real terms on average from January 2012 to April 2013 (Figure 5). For employees of new single-family general contractors at the national level, hourly earnings rose 1.8 percent in real terms. In Texas, hourly earnings of construction employees rose 5.8 percent in real terms during the same period after falling during the Great Recession. Hourly earnings for employees of new single-family general contractors and Texas construction contractors in general have not regained their pre-crisis levels. In April 2013, the two groups’ earnings represent 89.6 percent and 87.3 percent, respectively, of what they earned in January 2007 in real terms.
Estimating Producer Price Index for Home Inputs
Wood and lumber and drywall together represent almost 18 percent of the construction cost of a new single-family home. If there was a 10 percent increase in both wood and lumber, and in drywall, and prices of other inputs did not change, the overall cost of the home would increase by 1.8 percent.
A PPI for building a new single-family house would be a better indicator because a complete cost of building index would incorporate the overall impact of the inputs. It would reflect the spending patterns for each different type of home builder and would be based on the expenditures of almost all home builders in urban or metropolitan areas.
Unfortunately, no estimated index of this kind exists. The closest PPI index available is the one for materials and supply of inputs to residential construction. It measures changes in price movements of materials and supplies typically sold to the construction sector and used in building new single and multiple residential units. This index is derived from the industry primary product PPI and the weights are based on the 2002 benchmark input/output relationship data from the Bureau of Economic Analysis. This index replaced a single-unit residential construction PPI that was discontinued in the summer of 2010, making it a close substitute to measure price changes in the inputs used to build single-family residential homes.
The information presented in the NAHB construction cost survey is used to estimate a PPI for the inputs used to build an average single-family home. The expenditure breakdown from the most recent construction cost survey (2011) was used as the base year. This index was estimated from January 1995 to May 2013 using the Laspeyres methodology with fixed weights.
In the survey, the average size of a home built was 2,311 square feet, so the spending structure is based on that size. Increases in the PPI for finished goods will be applied to the various fees paid by home builders to local governments, even though fees are normally increased on a yearly basis. The PPI for inputs to residential construction were applied to the rest of the cost categories, with the exception of framing and trusses, and drywall. For those two categories, the PPI for softwood lumber and drywall for building materials were used, respectively.
This was done to capture the effects of the increases for wood and lumber and drywall on total construction costs, while the prices of the other inputs follow the overall price trends in the economy and the residential construction industry. The estimated PPI is a measure of the average change over time in the prices paid by home builders for a market basket of inputs used to build single-family homes.

From January 2012 to May 2013, the estimated PPI registers an annual average growth rate of 4.7 percent, a greater price increase than the PPI for finished goods (1.8 percent) and inputs to residential construction (2.3 percent) (Figure 6). The higher price growth reflects increases in prices of framing and trusses, and drywall. It is greater than the historical annual trend observed from January 1996 to May 2013 (2.2 percent), and lower than both the PPI for finished goods (2.5 percent) and inputs to residential construction (2.7 percent) during that period.
This shows that the housing recovery has been accompanied by an increase in the cost of single-family housing inputs and that the price hike has been relatively higher than the one observed in the rest of the economy and in the construction industry (1.7 percent). While they do affect profit margins for home builders, overall these price increases are within the limits of price stability, especially because they are temporary.
Price increases for these inputs have not increased at an exponential rate. When output and supply are restored, especially for wood and lumber, prices should return to a more moderate growth rate and to their long-run price trends but still will be affected by world demand and supply.
Dr. Torres ([email protected]) is an associate research economist with the Real Estate Center at Texas A&M University.
Did you like this Article?


