It will hurt, but American households will have to liquidate their assets and reduce debt if they want the economy to recover. This means selling luxury items including vacation homes, boats and RVs, as well as liquidating investments, declaring bankruptcy or suffering through foreclosure.
Jan 23, 2012
Dialing Down Debt: Road to Recovery Begins at Home
Although the ongoing debate over the national deficit accounts for much of the shouting going on in Washington, the truth is that American households need to pay off their debt, too.

It is time for an honest discussion about household debt levels in the United States. How much debt are households carrying? Will they be able to pay it back? What happens if they can’t? How will it impact banks?
Bank expectations of future losses are reflected in the level of loan loss provisions made on their financial statements. Banks have so aggressively released loan loss reserves in the past year that the positive impact on earnings has covered the weakness from revenue declines caused by falling loan balances.
The FDIC’s Quarterly Banking Profile for first quarter 2011 reports banks reduced loss reserves by $30.9 billion, or nearly 60 percent, in the prior 12 months. Total provisions for losses are now at $20.7 billion, the lowest level since third quarter 2007.
Current household debt is very high by historical standards. Do banks really think households will successfully pay down their current debts? If households can’t pay, is $20.7 billion enough to absorb all the losses that might occur?
On earnings calls, senior bank executives continue to report improving credit quality. Few investors have questioned this judgment, just as they didn’t question earnings quality back in 2006 and 2007. But if all is well for banks, why has the St. Louis Fed’s Financial Stress Index (Figure 1) hit the same level as before the 2008 financial crisis? Are financial markets telling us something different than bank executives?

Household debt levels can be examined from three different perspectives:
- Household debt-to-income ratio,
- Household debt-to-asset ratio and
- Household mortgage debt-to-GDP ratio.
All three measures indicate U.S. households are in uncharted territory. The current level of household debt truly is unparalleled. If household credit growth drives economic recoveries, this recovery will be like nothing we’ve seen since the Great Depression. It is time to take the blinders off and scrutinize the implications for the financial system and the economy for the next ten years.
Household Debt-to-Income Ratio
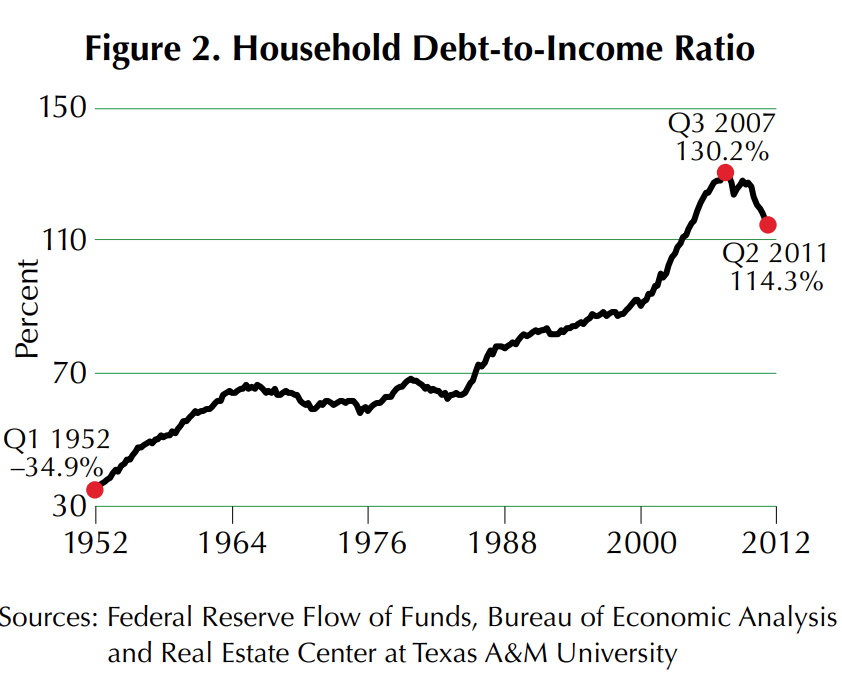
The ratio of household debt to income remained relatively stable from 1965 to 1985, fluctuating in a range around 60 percent (Figure 2). Then in 1986, a fundamental change occurred. Americans became increasingly comfortable with debt.
A closer look at key events from 1986 to 2006 reveals important changes that explain why debt increased significantly and drove massive economic growth (Figure 3).
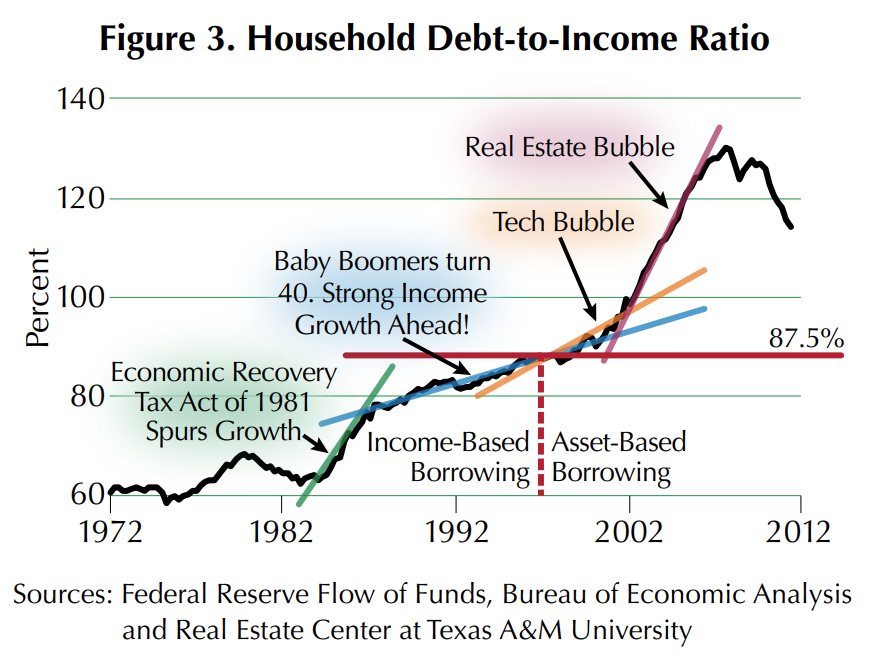
The Economic Recovery Act of 1981 significantly spurred growth in household debt by lowering personal taxes, making more disposable income available to service debt. The strong growth in debt moderated by 1986 but grew steadily for the next decade.
In 1986, the first Baby Boomers turned 40 with their highest earning years ahead of them. They justified taking on more debt by anticipating that their incomes would “grow” into it. This growth in debt fueled a surge in economic activity as Boomers purchased bigger homes, minivans and vacations for their growing families.
In 1996, the Tech Bubble took hold and propelled household debt to a new level. Prior to 1996, borrowing was fueled primarily by current income and expected income growth. After 1996, U.S. households became comfortable with asset-driven borrowing. They expected to fund their retirement years through stock price appreciation rather than traditional savings. Growing stock portfolios gave Americans the confidence to save less and redirect their discretionary income to servicing new debt. The resulting growth in debt fueled strong economic growth.
When the Tech Bubble ended in 2001, households turned their lust for collateral to the homes in which they lived. The rallying cry of “My house is my retirement plan” could be heard in the hottest real estate markets across the country. Asset-based borrowing fueled further growth in household debt, which rose to a historically stratospheric level of 130 percent of income.
The widespread use of partially amortizing loans added to the debt level taken on by households. At the peak in 2008, U.S. households were straining under the burden of $13.9 trillion dollars in debt, equivalent to 96.6 percent of GDP.
When the real estate bubble burst, the age of deleveraging commenced. Not since the Great Depression have U.S. households exhibited such an adverse attitude toward debt. Yet the primary actions of Congress and the Federal Reserve to stimulate economic recovery have revolved around enticing Americans to take on additional debt. Is it any wonder their efforts are failing? The economy will not recover until households have reduced their debt to long-run “normal” levels.
Many have asked how long it will take for the economy to recover. Like children in the back seat of the car during a long family vacation, households repeatedly ask “Are we there yet?” A simple ratio analysis demonstrates that there is a long way to go.
If we assume that the “normal” debt-to-income ratio is 87.5 percent (harkening back to the last time borrowing was income-based), households should be expected to reduce their total debt level to $10.1 trillion based on current income levels (the long-run average ratio is approximately 80 percent). If we compare the amount of net debt extinguished to date with the “normal” level, deleveraging is 21 percent complete with $3.1 trillion left to go (Table 1). This debt will be extinguished through repayment or default.

The level of debt households can support based on their disposable income after taxes will be a hotly debated topic in the coming years as we wait for deleveraging to end. Those who argue that a higher total level of debt can be supported point to lower interest rates that reduce debt service costs. Rates are currently low so households should be able to support this higher level of debt without defaulting. What if interest rates rise? Four arguments can be made to show the current level of debt is not sustainable:
- Baby Boomers are entering a period of secular income decline as the first of this cohort turns 65 in 2011. They will have less income available in the future to service debt as they begin to retire.
- Increased household savings because of lower expected return on assets means less income available to service debt. When bond and CD yields are so low, all households recognize the need to save more for retirement.
- Echo Boomers won’t hit strong earnings growth until 2020 (assuming the cohort began in 1980). Of course, this assumes their spending habits and attitude toward debt will be the same as their parents.
- Future tax increases to reduce the budget deficit will have the exact opposite effect on household debt that the Economic Recovery Tax Act of 1981 had when taxes decreased.
For these reasons, expect the deleveraging process to be prolonged and the economic recovery to be delayed.
Household Debt-to-Asset Ratio
The household debt-to-asset ratio provides insight into how households will extinguish their debt. One way to analyze households is to look at their balance sheets. Every household has assets, liabilities and equity.
The process of deleveraging means households are reducing their liabilities. They do this by making payments out of their income or liquidating assets (for example, selling their home, foreclosure, or drawing down savings).
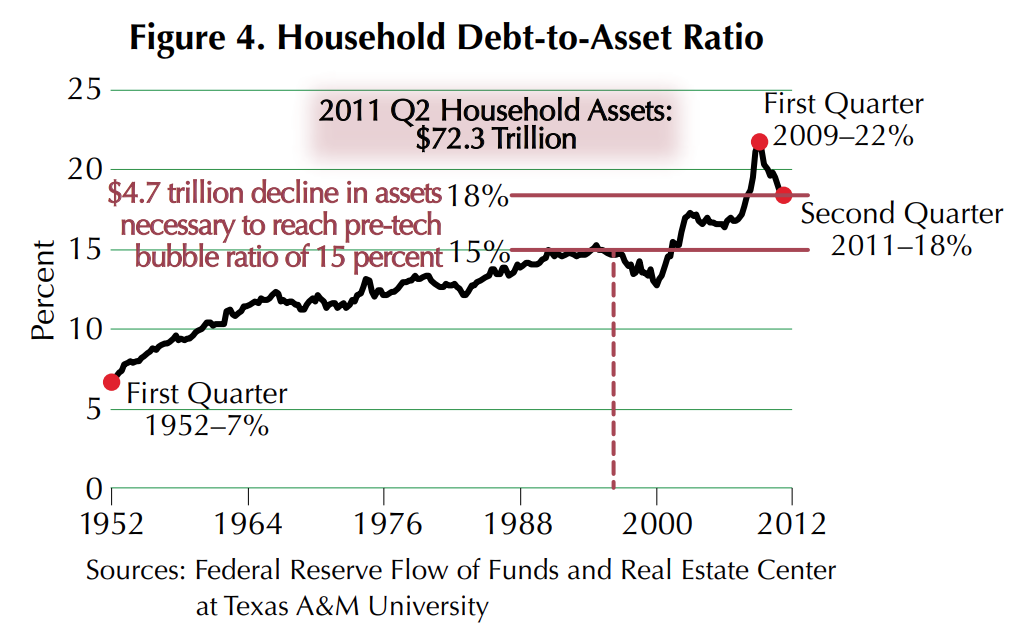
The current debt-to-asset ratio is 18 percent compared with the “normal” debt-to-asset ratio of 15 percent in 1996 (Figure 4). If the normal sustainable household debt level is $10.1 trillion and the normal debt-to-asset ratio is 15 percent, the market value of household assets needs to decline by $4.7 trillion to retain the “normal” relationship between debt and assets (Table 2).
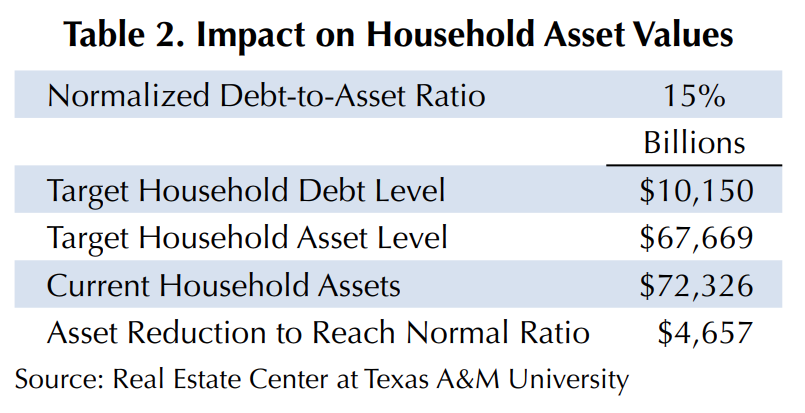
Household assets will be reduced through:
- Selling vacation homes, boats and RVs,
- Selling second and third cars and other used belongings,
- Selling investments (stocks, bonds),
- Withdrawing money from retirement accounts,
- Selling their primary residence and becoming renters,
- Declaring bankruptcy,
- Foreclosure and
- Declining market value of assets.
Household Mortgage Debt-to-GDP Ratio
Examining the ratio of mortgage debt to GDP provides corroborating evidence that deleveraging will be significant. Figure 5 illustrates the current and normal ratios of mortgage debt to GDP (assuming 1996 is normal).
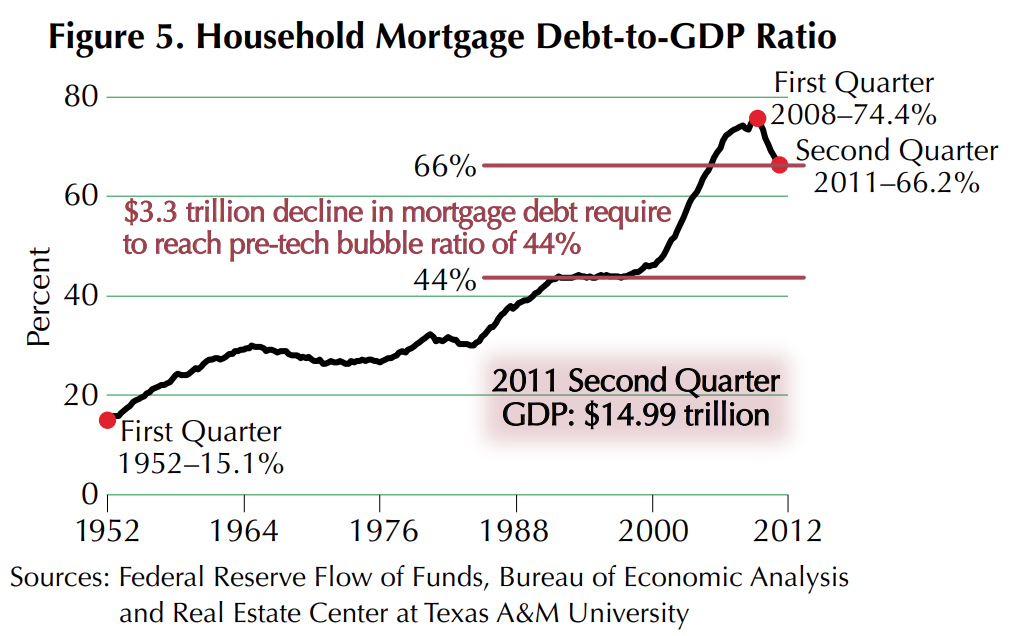
For the ratio to return to 1996 levels, approximately $3.3 trillion of mortgage debt needs to be extinguished. This is slightly more than the $3.1 trillion indicated by the debt-toincome ratio, but it is in the ballpark.
The implications for this level of decline are clear and significant for those involved in mortgage origination and servicing. A nation with fewer homeowners needs fewer mortgages. New funds will be needed by investors who purchase foreclosed homes for rental property.
Facing Reality
To take the right steps toward economic recovery, the problem of household debt must be confronted realistically. Household debt will not increase and drive economic growth until it has first decreased to its long-run average. The reversion process is especially painful because it must overshoot the average before it can return to average. The overshoot is necessary because household debt has been above the average for so long.
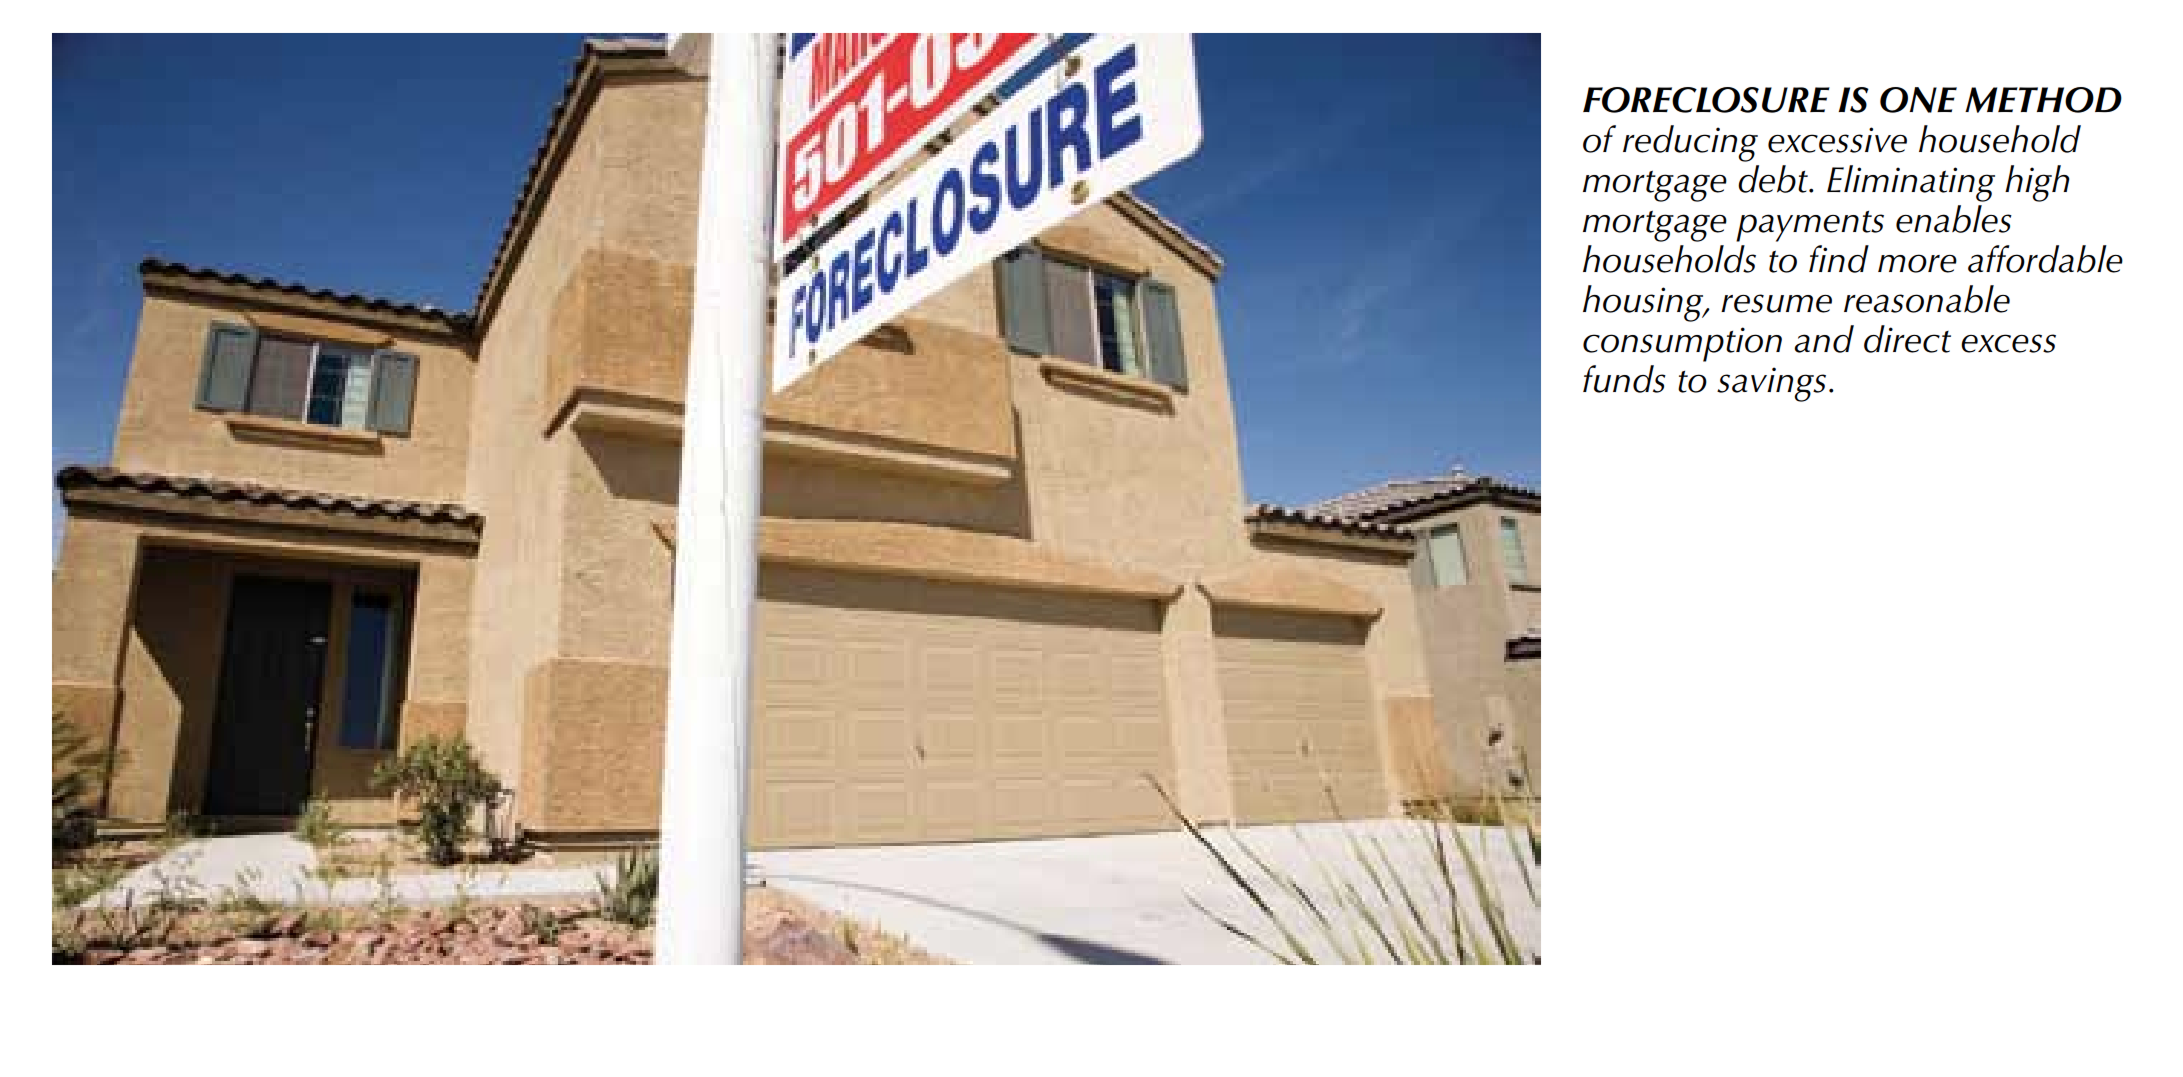
Rather than delaying foreclosures and continuing to extend and pretend, the more appropriate action is to accelerate debt extinguishment through foreclosure and bankruptcy. This will free households from excessive debt and give them the flexibility to rearrange their finances and return to a responsible level of borrowing and consumption. Some of these foreclosed homes will become rental property for investors.
Only when the debt extinguishment process is complete will confidence in the quality of bank assets be restored. Until that time, bank managers and regulators will make nuanced statements about the adequacy of loss provisions while markets contradict them through various measures of financial stress. Worst of all, everyone will wonder why banks aren’t lending more even though they profess to be healthy.
It is highly probable that the loss provisions at many banks are inadequate. An industry total of $20 billion in provisions is not going to get the job done.
We must accept that a significant amount of household debt currently outstanding will be extinguished through default. While foreclosure is painful to both borrower and lender, it is a necessary process. Our parents and grandparents have survived difficult times like this. So can this generation.
The housing market will begin a real recovery cycle when the foreclosure process nears completion. It has to happen sometime. The sooner the better for the economic future of our country.
Klassen ([email protected]) is a research analyst with the Real Estate Center at Texas A&M University.
Did you like this Article?