Falling home prices and the lowest mortgage interest rates in nearly 70 years make homeownership conceptually the most affordable it has ever been. Home prices have moved more in line with historical norms relative to income, even with tight mortgage credit. Texas and Texas’ major metro areas remain among the most affordable places in the country as measured by the Center’s Housing Affordability Index.
Jul 20, 2012
State of Affordability
How much house can Texans afford? According to the National Association of Realtors’ and Real Estate Center’s affordability indexes, way more than residents of other states.

“Housing affordability” refers to the relationship between household income and housing prices. Because the majority of owner-occupant buyers rely on mortgage debt financing, they need to know how much income is necessary to qualify for a loan to buy a particular home.
Home Affordability Indexes
General affordability indexes, such as the ones produced by the National Association of Realtors (NAR) and the Real Estate Center, look at the relationship between median family (or household) income and median home price.
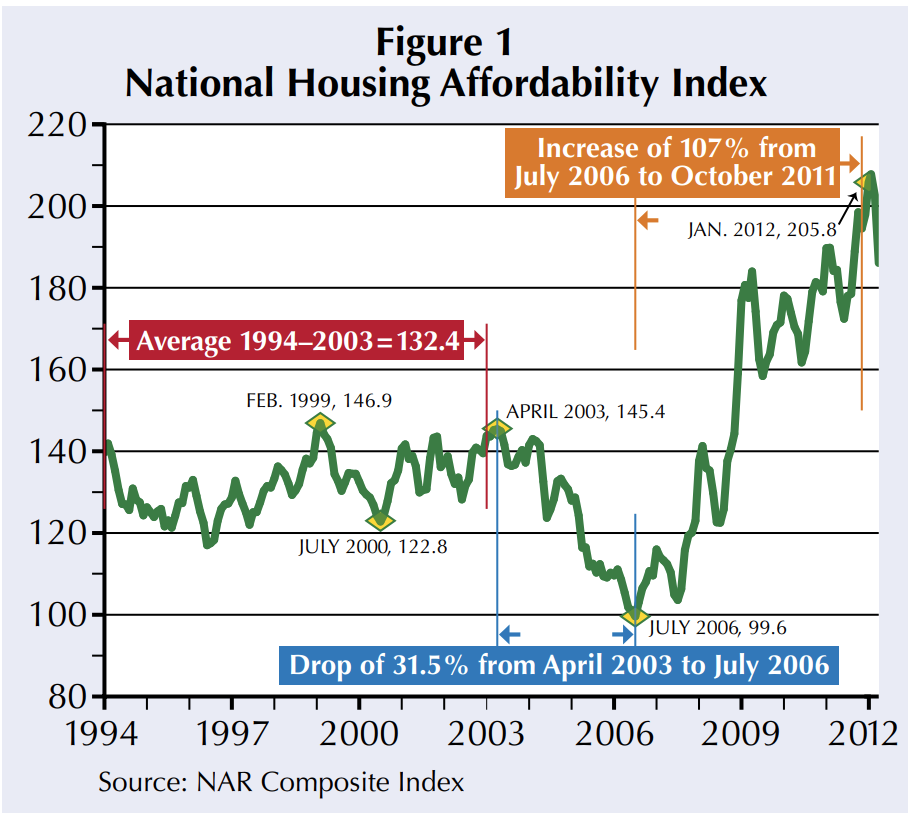
NAR’s national composite affordability index reached a record high in early 2012 based on a substantially lower median home price and mortgage interest rate and despite static-to-falling median household income (Figure 1).
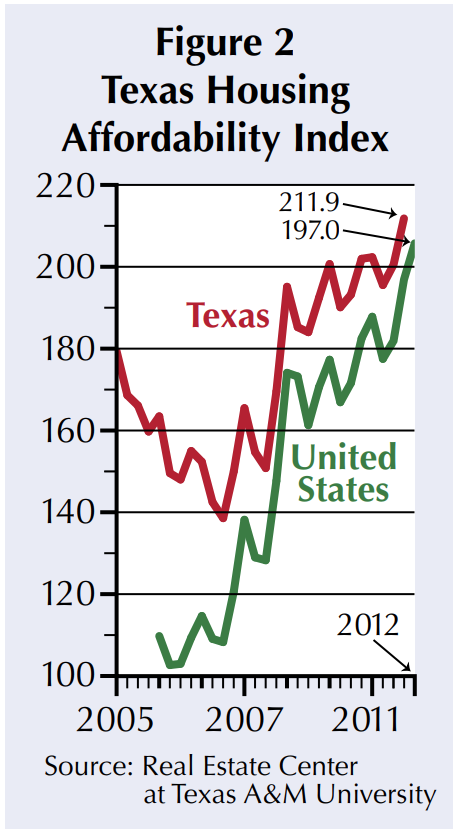
The Center’s Texas Housing Affordability Index (THAI) suggests that housing has been consistently more affordable in Texas than for the United States and that the spread in affordability has increased during the recent housing downturn (Figure 2).
The NAR index and the THAI reflect the ratio of the areawide median family income to the income needed to qualify for a mortgage to buy the median-priced home under a specified set of mortgage financing conditions [(Median Family Income ÷ Required Income) × 100]. If the required income to purchase the median-priced home is exactly equal to the median family income, the index value would be 100.0.
Both indexes are computed in the same way but use different median family income estimates. NAR computes an estimated quarterly median family income based on Census Bureau decennial data. The THAI applies the annual median family income estimate provided by the Department of Housing and Urban Development (HUD) to compute each quarter’s index. Median home prices are estimated by each group according to sales data compiled by local Multiple Listing Services (MLS).
Both measures compute the annual income a lender would require a borrower to earn to afford the monthly payments for an 80 percent, 30-year mortgage to purchase the median-priced home at the “effective” mortgage interest rate reported by the Federal Housing Finance Board. The requisite income for both indexes is based on an assumed, lender-mandated 25 percent qualifying ratio. That is, the monthly mortgage payment can be no more than 25 percent of the borrower’s gross monthly income.
Both ratios ignore other monthly costs of homeownership as they vary significantly from one area to another. Including other monthly costs of ownership would be offset by increasing the applicable qualifying ratio, generally to 35 to 40 percent.
Because information on the percentage of potential buyers who can put 20 percent down is not available, the affordability indexes no doubt overstate true affordability. As the requisite down payment declines, the amount financed increases and, therefore, the required income increases. Additionally, as the down payment declines, some lenders will charge a higher interest rate to reflect the greater risk of the loan, raising the monthly payment and decreasing overall affordability.
NAR’s first quarter 2012 index of 225.9 indicates that the current median family income is more than twice as much as is required to buy the national median-priced home under the assumed financing. The THAI fourth quarter measure of 211.9 indicates that median family income in Texas is also more than twice the required income.
The two main causes of the increase in affordability have been the changes in median home price and interest rates. The national median home price declined 25 percent between 2006 and 2011, while the Texas median home price increased a modest 4 percent over the same period (Figure 3).

Texas’ major markets are among the most affordable metropolitan areas in the country (see table). Fort Worth shows the highest level of affordability based on the combination of local median family income and home prices. Austin is somewhat less affordable and has the highest median home price in the state.

Texas’ 2011 THAI was 21 percent above the 2005–11 average, and the national index was nearly 56 percent above average. Affordability in 2012 will probably be even better at the national level as interest rates and the median price stay steady at current levels. Texas’ affordability, however, may statistically decline slightly as prices begin to firm and rise faster than income in some areas.
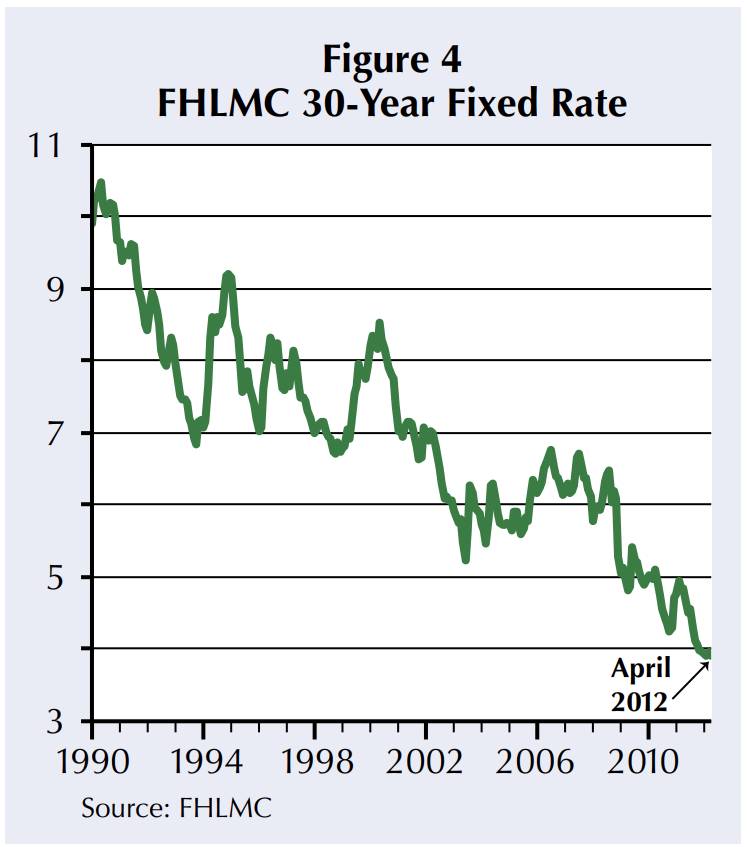
Since 1991, the Federal Home Loan Mortgage Corporation’s (FHLMC) 30-year, fixed rate mortgage averaged 6.8 percent, significantly above the current level of around 4 percent (Figure 4).
The impact of lower interest rates on housing affordability is readily apparent. For example, to buy a $150,000 home with a 30-year, 80 percent loan at 9.64 percent (the rate in January 1991) the monthly mortgage payment would be $1,021.31. A buyer would have to have an annual income of $49,023 to qualify for a loan with a 25 percent qualifying ratio. The price-to-income ratio would be 3.06 ($150,000 ÷ $49,023).
At the long-term average 6.8 percent rate, the monthly mortgage payment to buy a $150,000 home would be $782.31. The required income to buy the same house falls to $37,351 or 23 percent less and the price-to-income ratio rises to 3.99. To buy the same $150,000 home at the current 4 percent rate, the monthly mortgage payment would only be $572.90 and the required income would only be $27,499 or 27 percent less than for a 6.8 percent loan and 44 percent less than for a 9.64 percent loan. The price-to income ratio rises to 5.45.
The home purchasing power of a dollar in income increases dramatically as interest rates fall. Assuming a buyer obtains an 80 percent loan, if the mortgage interest rate is around 10 percent, $1 of income would buy about $3 of housing. At a 7 percent interest rate, $1 of income buys about $4 of housing, and at a 4 percent rate, $1 of income buys nearly $5.50 of housing. In the previous example, if a buyer had the $49,023 required income to afford the total monthly payment at the highest rate, they could buy a house priced nearly $270,000 at the lower rate.
Return to Historically Sound Levels
If mortgage lenders tighten underwriting requirements by increasing the qualifying ratio, the effective price-to-income ratio goes down, and the home purchasing power of $1 in income falls. Of course, if underwriting standards become looser, as they did during the mid-decade housing boom, the ratio increases, and buyers can purchase more housing for a given amount of income. This effect is clear in tracing the effective price-to-income ratio for the

United States and Texas over the past 36 years. As the data indicate, Texas’ price-to-income ratio stayed below 4.0 even during the housing boom whereas the national ratio ballooned to unsustainable levels (Figure 5). The national ratio continues to trend toward the Texas rate as lenders apply stricter mortgage underwriting, and the housing market returns to a more traditional and sustainable level. The current multiple is as high as it is because of historically low mortgage interest rates and a falling median price. If mortgage interest rates were in the 6 percent to 7 percent range, the national rate would be approaching 3.0, and Texas’ rate might be in the 2.5 to 2.8 range.
Texas Affordability Pyramid
Overall affordability can also be traced by translating household income data into the distribution of homes by price that households can afford to buy. This distribution results in what is called an affordability pyramid. The pyramid shows the percent of households that can afford to purchase a home at different price levels. The U.S. Census Bureau’s American Community Survey provides detailed income distribution data for the country, states and local areas. The most recent year of data availability is 2010.
One estimate of the Texas affordability pyramid is based on conventional financing with 10 percent down, a 4 percent fixed-rate mortgage for 30 years and a qualifying ratio of 33 percent based on total monthly ownership cost (Figure 6). Other costs of ownership are included based on an assumed annual effective rate of the home value. The relatively low down payment means more required income to qualify for the greater mortgage, making affordability slightly less.

For purposes of analysis, additional monthly costs are based on an estimated annual effective percentage of a home’s value. The additional monthly costs include taxes at an effective annual rate of 3 percent of home value, property insurance at 0.8 percent, and utilities (water, sewer, gas and electricity) at a 2 percent annual rate.
For a $100,000 home, for example, property taxes would equal $3,000 per year or an average of $250 per month; insurance would equal $800 per year or $66.67 per month; and utilities would be $2,000 per year or $166.67 per month. In this case, other homeownership costs total $5,800 per year or an average $483.33 per month, an amount 12.5 percent greater than the monthly mortgage payment of $429.67 per month under the assumed financing. Based on the qualifying ratio and a total monthly housing cost of $913.01 ($429.67 + $483.33), the required income to qualify for the loan would be $33,200 per year.
As expected, the base of the Texas pyramid indicates a substantial number of low to modest income households that can afford relatively modest-priced homes. Based on the assumed financing, nearly 35 percent or about 3.02 million Texas households cannot afford to buy a home priced more than $100,000.
Of the remaining households that can afford to pay more than $100,000, around 16.3 percent or approximately 1.42 million Texas households can only afford to buy a home with a top price of $150,000 (the second step in the pyramid). This trend of fewer households being able to afford the maximum price continues in successive steps except for the $300,000 to $400,000 level. The distribution of Texas household incomes exhibits a bulge in the $60,000 to $125,000 income intervals (approximately 28.5 percent of Texas households fall in this interval). This explains how more households can afford a home in this price interval than in the preceding one.
The peak of the pyramid is somewhat larger, reflecting the open-end nature of higher priced properties, but is consistent with the state’s household income distribution. The required annual income to purchase a $600,000 home is $200,000. According to 2010 Census data, 332,563 or 3.8 percent of all Texas households had incomes of $200,000 or more.
By almost any measure, homeownership remains more affordable in Texas than for the United States overall. Texas’ median home price remains at a comparative advantage relative to the U.S. median although the gap between the two has narrowed substantially in the past couple of years.
Dr. Gaines ([email protected]) is a research economist with the Real Estate Center at Texas A&M University.
Did you like this Article?
You might also like

2 minute read
Feb 23 2023
Texas Housing Affordability Outlook
Affordability continued to decline in 4Q2022 amid higher mortgage interest rates and still-elevated home prices. Although home price appreciation declined substantially from record highs observed in the first two years of the COVID-19 pandemic.


