If it pleases the court, TRERC Research Director Daniel Oney presents overwhelming evidence showing how the legal industry is a major driver in the state’s office markets.
By
Daniel Oney
quick links
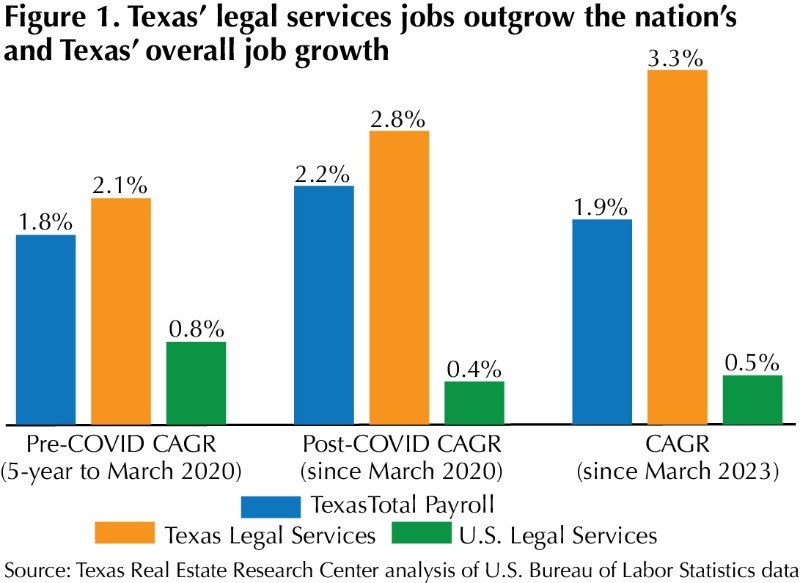
The legal industry has been growing slowly across the country, but much faster in Texas. The industry is a substantial employer in the state, with over 104,000 jobs by spring of 2024. Job growth in the legal services industry, which includes a few small sectors beyond law firms, has accelerated. Both before and after COVID, legal services grew faster in Texas than they did nationally. The industry also grew faster than Texas’ overall payroll employment (Figure 1).
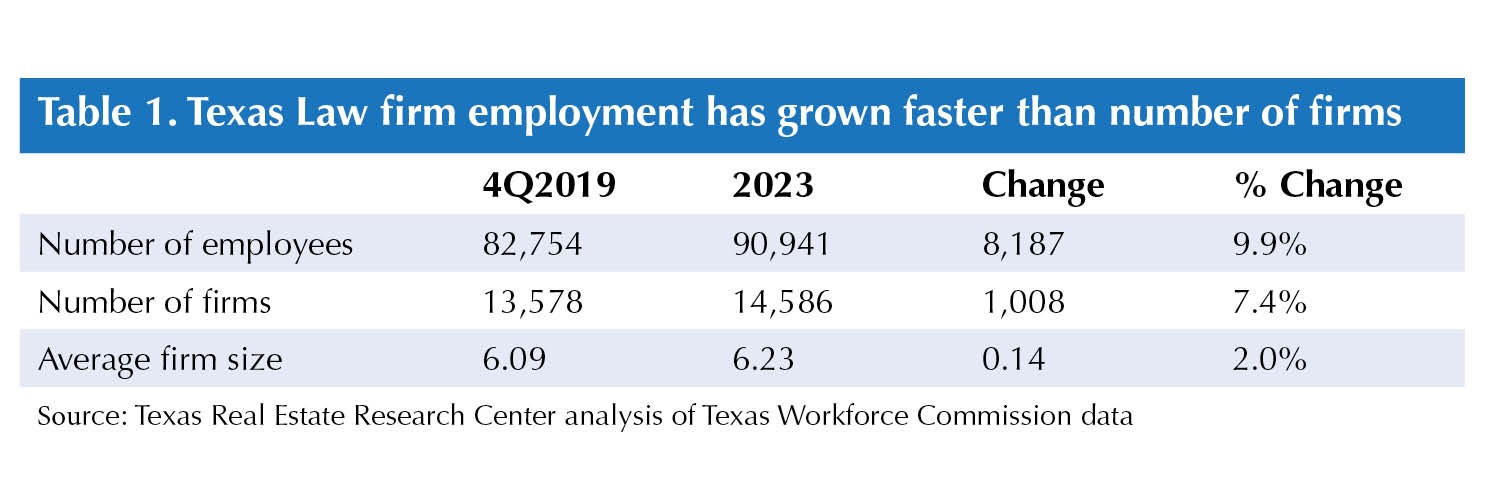
The number of Texas law firms also increased. In the last decade the number of firms grew 13.3 percent (about 1.3 percent annually). Firms with payroll employees now total almost 14,600 statewide. Despite this growth, the industry is less concentrated in Texas than it is nationally. Legal service employment is only 97 percent as prevalent in the state as it is nationally. This growth means positive demand for office markets.
Beyond raw growth, the structure of the industry also impacts office demand.
Mid-size and large firms are prime tenants taking down large blocks of downtown office space, but these firms are few in number. Most law firms are small (Figure 2), and they play an important role in many submarkets. Of the 41,000 Texas firms, 64 percent are single-person firms (that is, self-employed attorneys). Two-thirds of the 15,000 remaining establishments have fewer than five employees. Law firm size has increased slightly since COVID, and law firm employment has grown faster than the number of firms (Table 1).
Small firms with employees are likely to lease at least some office space. Self-employed attorneys have more options. They may work from home or at client locations, or they may pay for coworking or old-fashioned executive suites. Virtual offices are common. These arrangements provide a mailing address in a conventional building with on-demand access to conference and meeting room space. Some self-employed attorneys sublet a desk at larger firms. Cumulatively, small firms likely account for many millions of square feet of office space use, but in small increments.
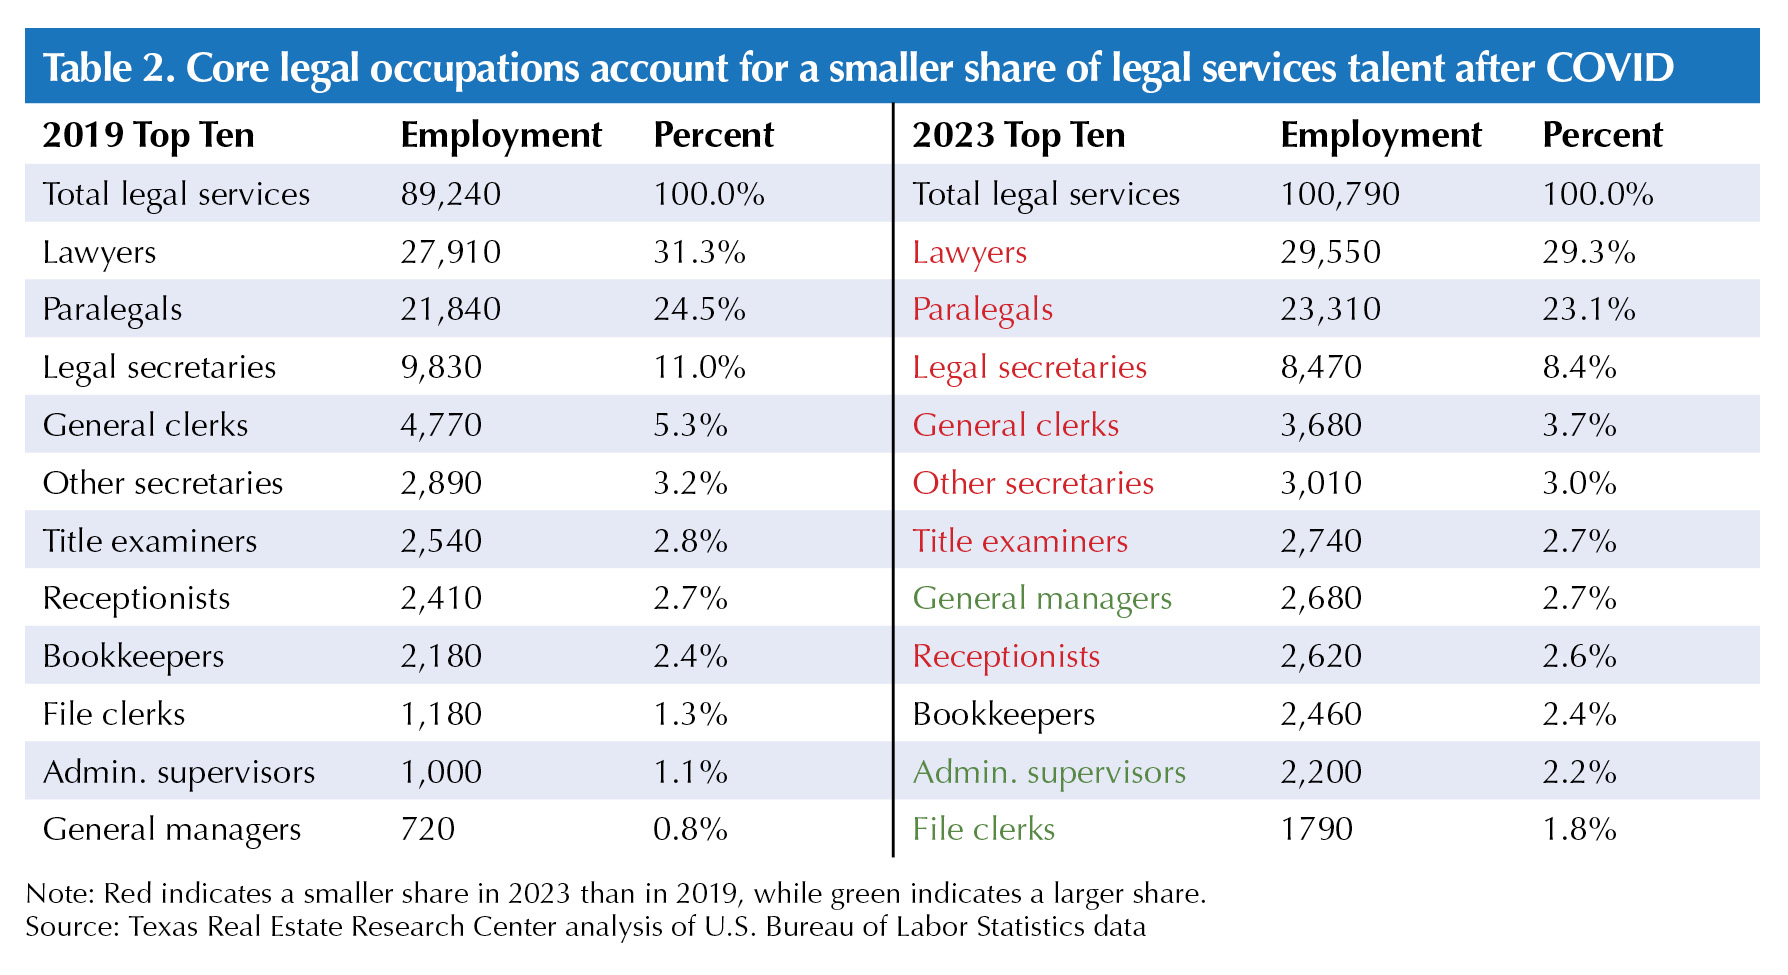
The mix of employees in law firms represents ongoing changes in legal work and the adoption of technology. These occupational trends also impact the layout of offices and the total market demand for office space. In Texas, the industry has seen some changes in the mix of job types.
The top six occupations in legal services remained the same in 2019 and 2023 (Table 2), but all six made up a smaller share of total legal services employment in 2023. Legal secretaries had the largest percent decrease in their share of total legal jobs at 2.6. This was followed by a 2 percent share fall for attorneys (even though the total number of attorneys increased). General clerks’ and paralegals’ shares fell by 1.6 and 1.4 percent, respectively. Bookkeepers, administrative supervisors, and general managers saw their shares of total employment grow. (See appendix for a comparison of the Texas and U.S. legal workforce.)
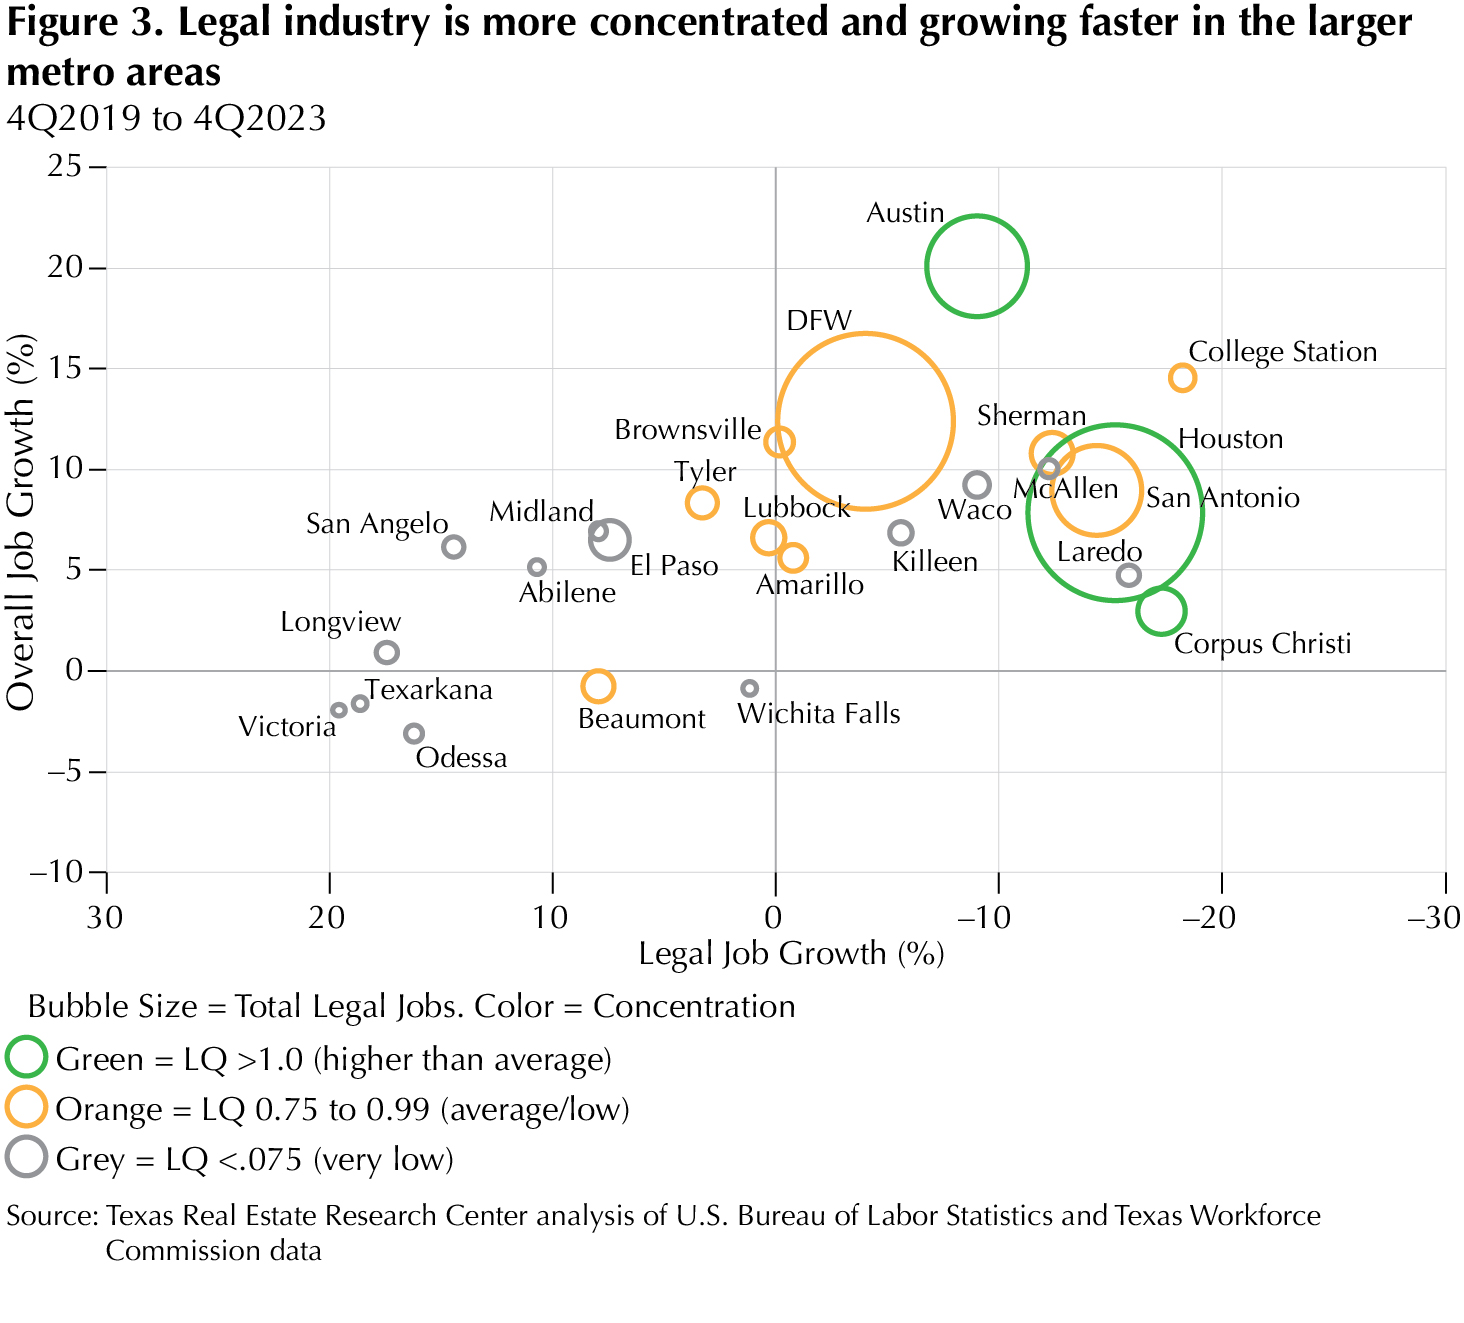
The legal industry has, on the whole, grown in Texas, but the situation differs from market to market (Figure 3). Legal industry employment growth is associated with overall Metropolitan Statistical Area (MSA) job growth, as exhibited by the upward-sloping pattern. The largest metropolitan areas have the largest legal employment, and they tend to have faster-growing legal employment than smaller MSAs. Many smaller MSAs have lost legal services jobs.
While the industry in Texas overall is less concentrated than it is nationally, three Texas metros have a higher-than-national-average concentration: Corpus Christi, Houston, and Austin. These MSAs have location quotients (LQ) of 1.44, 1.23, and 1.04, respectively. All other Texas metro areas have a lower-than-average concentration. (See appendix for more details about each metro’s legal industry.)
A generally growing legal industry is a bright spot for office markets, but how these macro trends translate into net new demand will depend on law firms’ workplace and workspace policies.
Workplace and Workspace Trends
Firm business models, technology choices, staffing strategies, and client location and activity ultimately determine demand for space. These influence factors like the location, amount, and quality of space leased.
Before COVID, law firms were slowly rethinking their real estate policies. Firms realized they were underusing their space. Employee travel and early, limited work-from-home policies meant vacant offices many days of the week. For a generation at least, new technology had also been changing legal work. Personal computers and new habits by younger associates allowed firms to reduce the ratio of support staff.
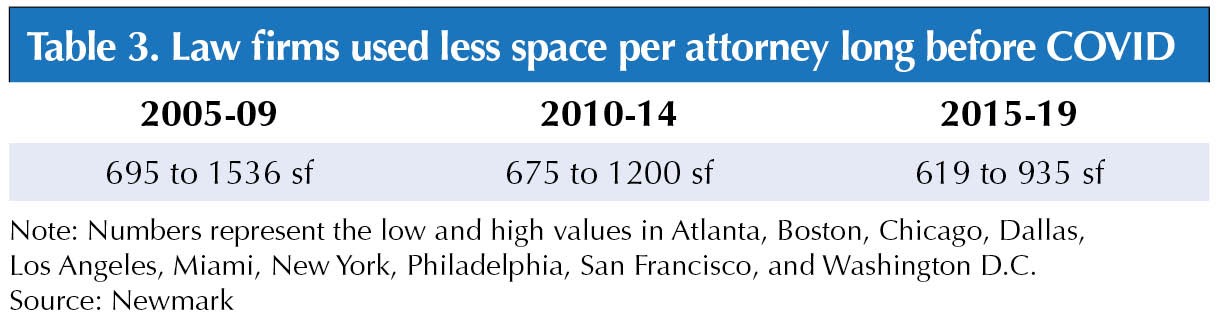
More recently, e-discovery tools lowered the demand for associates. Support staff per attorney has fallen nationally to one per five, with reports of as few as one per seven onsite support staff in some firms, according to international construction firm Stantec. With fewer staff and a different mix of occupations within the firm, workspace impacts were inevitable. The amount of space allotted per attorney began falling across major markets long before COVID (Table 3). The high-end range estimate fell by 39 percent, while the low end saw a less dramatic drop of only 11 percent. This implies firms across markets are adopting similar, smaller space-use policies.
COVID had a major impact on law firms’ real estate choices, as it did with all office users. As a conservative workspace policy industry, law offices across the country tended to use space the way their peers did. Major brokerages and architecture firm’s post-COVID experience shows law firms are now more likely to adopt a custom real estate strategy. Still, a few major themes have emerged.
Location and lease decisions are similar pre- and post-COVID. The largest law offices in Texas are overwhelmingly concentrated in downtown areas (for quick access to courthouses). Of the 53 offices with at least 50 attorneys, only three are outside of a downtown-area ZIP code. Lease renewals before and after COVID remain less likely than relocations, and relocation leases are becoming more common, according to Cresa and CoStar. With much underused office space—and with many new trophy buildings delivered—firms can redefine workspace policies, improve efficiency, and rebrand for better talent attraction and retention.
Legal workplace policies mean better use of office space than by other industries. In early 2024, law firms’ space usage was 25 percent higher than the overall office sector at nearly 80 percent of pre-COVID levels, according to Kastle Systems. CBRE’s recent national survey of law firms found a spectrum of remote work policies in place. The most common policy was “primarily in-office” (3+ days a week in-office), a policy held by 47 percent of firms. This was followed by 28 percent with a “balanced” policy (equal days in- and out-of-office.) Fourteen percent were “fully/primarily remote” (3+ days out-of-office). Eleven percent are fully in-office. Larger firms have more flexible policies than mid-size and small firms. Hybrid work policies seem entrenched.
Firms are adopting new workspace models, and the trend of ever-falling space per attorney seems to be leveling off. Nationally, the evidence is mixed, but JLL reports that slightly more firms have taken less space in their new leases. This has been especially true of larger firms. Smaller firms have been as likely to add space as reduce it. Other space policies are notable. Law libraries and physical filing rooms are frequently converted to common amenity spaces like lounges or cafes or collaborative workspace.
Nationally, universal office sizes for attorneys and senior professional staff are more common than not. This tactic increases flexibility to accommodate firm growth and attorney career progression. Refits or new finish-outs can demise floors in ways that allow easier subleases. Some large firms have bifurcated their portfolio. They may have showcase offices in major markets and maintain simpler, working offices in low-cost cities for associates and administrative pools.
Law firms are in the driver’s seat and can take a more aggressive stance with landlords. Office over-supply in recent years makes this a tenant’s market. Firms are seeking and winning more flexible lease terms, significant free rent, and ample tenant improvements. Results vary by market, but one rent-free month per lease year and tenant improvements of between $90 and $150 per square foot are typical, according to Colliers. Owners of older buildings have accepted shorter leases than they preferred.
Texas Leasing Trends
Leasing behavior of Texas law firms has changed according to an analysis of 478 large law firm leases. Large leases are defined as those for more than 10,000 square feet and for tenants with at least 25 employees. These leases totaled almost 14.2 million square feet of office space spread across 14 of the state’s 25 metropolitan areas. DFW accounted for the most space at 5.9 million square feet, followed by Houston with 5.4 million, Austin with 1.6 million, and San Antonio with 700,000. The remaining 500,000 square feet were spread among ten smaller metro areas.
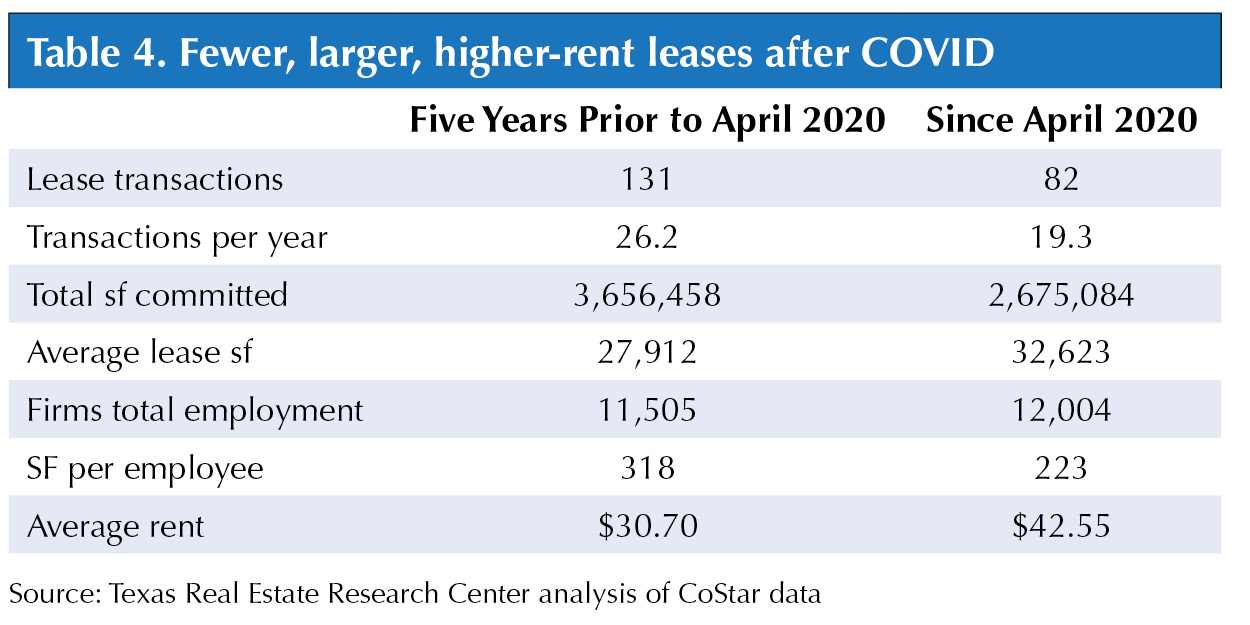
An analysis limited to a subset of large leases signed five years before and in the 51 months since April 2020 gives a pre- and post-COVID snapshot (Table 4.) Since COVID, there have been 49 fewer large leases than there were in the years before. There have been fewer leases per year since, and this likely reflects many firms still holding long pre-COVID leases. Post-COVID leases totaled 2.7 million square feet compared with 3.7 million square feet before. This resulted in larger average leases in recent years. Leased space per employee (not just attorneys) has, however, fallen by almost 100 square feet to 223.
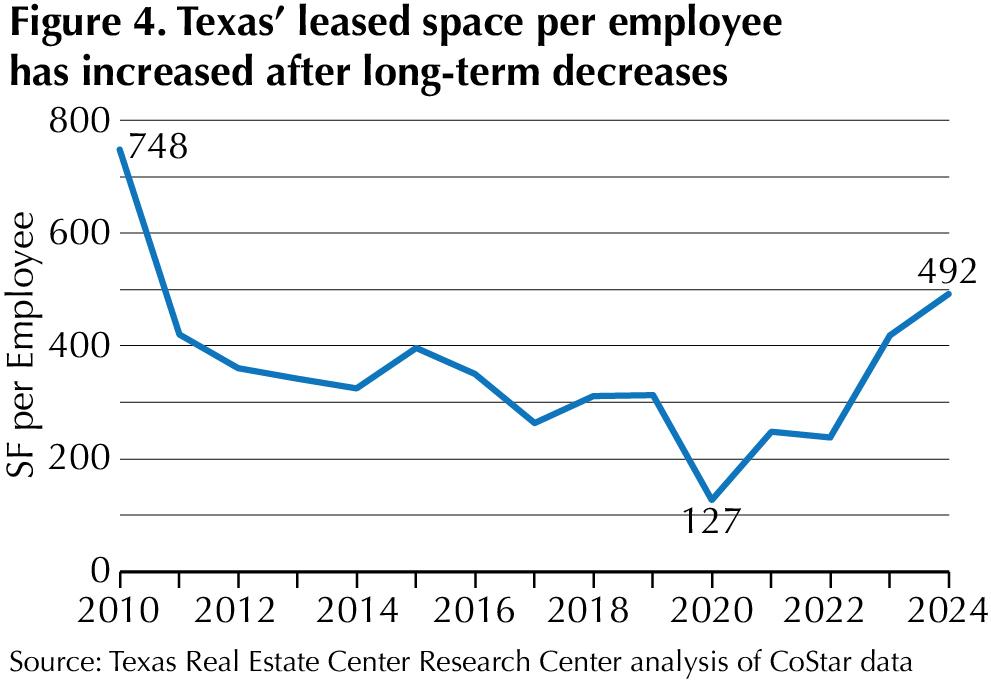
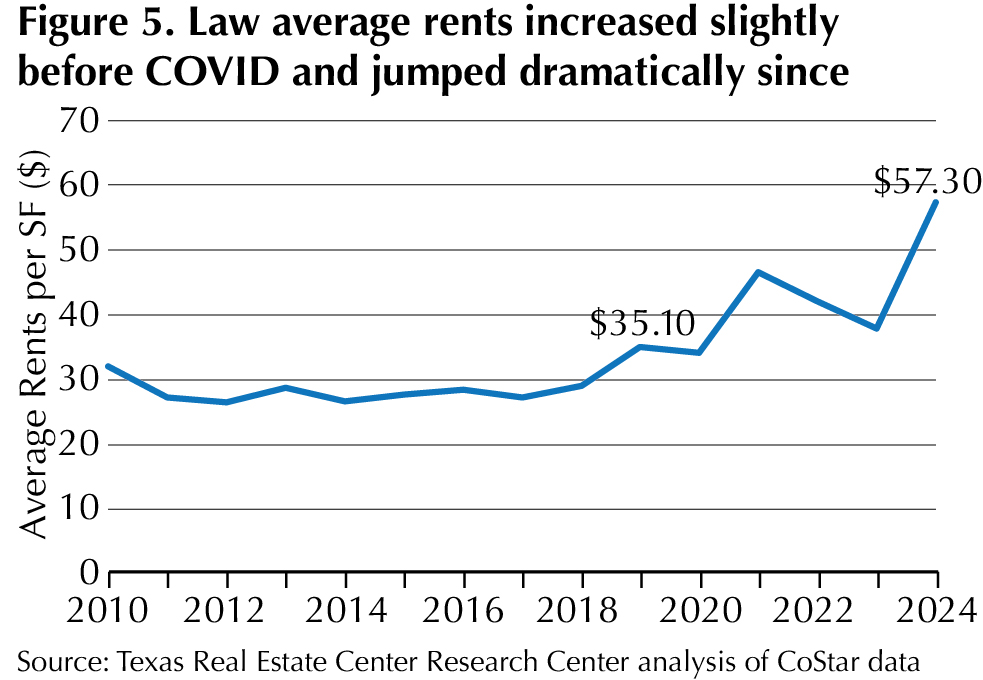
When evaluated year by year, however, more details emerge. The declining pre-COVID space-use trend is reversing. Average space per employee has risen again in recent years (Figure 4). It is not clear whether this represents a new normal for law firms or is simply opportunistic behavior by firms while landlords are eager to close deals. Meanwhile, rents are higher and reflect moves to new, high-amenity, Class A spaces rather than general rent increases (Figure 5).
The flight to quality began before COVID. After the Financial Crisis, as office construction resumed in most markets, law firms began moving to newer buildings. Nationally, these shifts led to firms paying over 20 percent more rent per square foot from 2015 to 2019 than in the prior five years. In Texas, the increase was not so dramatic, but, starting in 2018, law firm leases’ average rent rates began increasing after years of flat rents.
Anchoring Texas Office Markets
Law firms remain anchors for Texas office markets. In coming years it should be a net positive for office demand.
Overall industry growth will offset the tendency for some firms to economize space. The distinctives of legal work—its hierarchical culture, its confidential content, and its dependence on downtown—means it will long maintain more “traditional” workplace and workspace practices than other office users.
The industry cannot revive anemic office markets alone, but, for some landlords, law firms will remain essential tenants on their rent rolls.
Download PDF
Did you like this Article?
2
In This Article
Contents
Key Takeaways
Texas law firms lease over 14 million square feet of office space, mainly in downtown areas, making them pivotal tenants in the state’s office markets.
Unlike many businesses, law firms have favored conservative office setups with private offices, reflecting their emphasis on prestige and confidentiality.
Texas’ legal services sector is growing faster than the national average, boosting demand for office space, especially in larger cities.
Law firms are adopting hybrid work policies and rethinking office layouts to optimize space and attract talent, despite traditionally conservative practices.
Ask any market analyst and they’ll tell you there’s more than one way to count a job. This article gives you two, and together they provide a more complete understanding of Texas’ industrial job markets.
Is it time for commercial property owners to go back to school? Not necessarily, but universities could have much to teach about what tomorrow’s talent is looking for in a work environment.
As the state’s population grows, so does the need for more housing. Here are the data and tools you need to keep up with housing market trends in your area.
Whether you’re talking about DFW’s financial services industry, Austin’s tech sector, Houston’s energy corridor, or the medical hub that is San Antonio, commercial real estate is big business in Texas.
Mineral rights. Water issues. Wildlife management and conservation. Eminent domain. The number of factors driving Texas land markets is as big as the state itself. Here’s information that can help.
Center research is fueled by accurate, high-quality, up-to-date data acquired from such sources as Texas MLSs, the U.S. Bureau of Labor Statistics, and the U.S. Census Bureau. Data and reports included here are free.
Stay current on the latest happenings around the Center and the state with our news releases, NewsTalk Texas online searchable news database, and more.
Save the Date - April 8 - 10, 2026 Hyatt Regency Hill Country Resort. Registration is now open.
Courses
Legal Update & Broker Responsibility Instructor Training
For information on the upcoming 2025 Legal Update and Broker Responsibility Instructor Training courses, please see the Texas Real Estate Commission’s website.
Established in 1971, the Texas Real Estate Research Center is the nation’s largest publicly funded organization devoted to real estate research. Learn more about our history here and meet our team.