Housing costs as a percentage of total family income suggest which direction housing prices are headed. So does the ratio of sales price to rent. Currently, both suggest the likelihood of a major home price decline in Texas is negligible.
Jul 15, 2011
Bubble Radar
Aren’t housing bubbles awful? And wouldn’t it be great if we could get some kind of warning that a bubble was likely? Oh wait… We have an app for that (sort of).

During the past decade, Americans witnessed a home price bubble develop and then burst. The aftermath showed how broadly these bubbles impact the U.S. economy.
To monitor real estate price movements leading to price bubbles, a Real Estate Center research program developed economic indicators that help detect bubbles at both the national and regional levels.
Detecting Bubbles
Real estate bubbles are rapid rises in real estate prices not related to or driven by economic fundamentals, followed by rapid price declines. In residential real estate markets, property rents, family income and population are economic fundamentals for house prices. That is, in the long run, home prices are driven mainly by these three economic indicators. In the short run, the availability and costs of residential mortgage loans, changes in local job markets and imbalances between housing supply and demand can boost home prices, though these are not economic fundamentals.
Economists have developed several economic indicators for monitoring and forecasting real estate price movements by investigating the relationships between economic fundamentals and real estate prices. Comparisons of long-term real estate price forecasts with their short-term price fluctuations can provide insights into the probable directions of prices.
The Real Estate Center has developed two major economic indicators for monitoring residential real estate prices: housing costs as percentage of total family income and sales-price-to-rent ratio. A Center research study (see Center Publication 1944, “Consumer Spending Survey: Texas Downturn had an Upside”) found that the larger the share of housing expenditures in consumers’ budgets in large metro areas, the more home prices declined from 2007 to 2009. That study showed the importance of monitoring the percentage of family income spent on housing as a leading indicator for future home price movements. This indicator offers insights into the likely growth rates of home prices in a region.
Recently released 2009 housing data from the U.S. Census Bureau allowed the Center to investigate whether changes in home prices in Texas metropolitan areas from 2007 to 2009 were related to the share of housing costs in family incomes. The research shows that home price appreciation was lower in Texas cities where housing costs represented a larger portion of family income.
The sales-price-to-rent ratio also can predict real estate price bubbles. This idea is borrowed from asset pricing literature and the stock market, where the ratio of stock prices to dividends, earnings or profits is used to determine whether stock prices are overvalued or undervalued.
Stock prices are the discounted values of expected future earnings. The larger the expected future earnings, the higher the stock prices. If expectations prove unrealistic, stock prices generally fall.
Price-to-rent ratios in real estate markets resemble stock-price-to-earnings ratios in stock markets. Large ratios of home prices to annual rents are indications of potential home price bubbles. Estimating price-to-rent ratios for Texas metropolitan areas and comparing them with national averages, the Center asserted in two previous articles that the risk of a price bubble in the Texas residential markets was low (see Center publications 1731, “Bubble Talk” [July 2005] and 1854, “Bubble Watch 2008” [April 2008]).
Great Recession Housing Costs, Prices
The median value of owner-occupied housing units in the United States fell 4.7 percent from 2007–09, from $194,000 to $185,000 (see table). Over the period, only two Texas metro areas, Tyler and Victoria, recorded home price declines. The median value of owner-occupied housing units in Victoria and Tyler fell 3 percent and 1.5 percent, respectively, from 2007 to 2009.
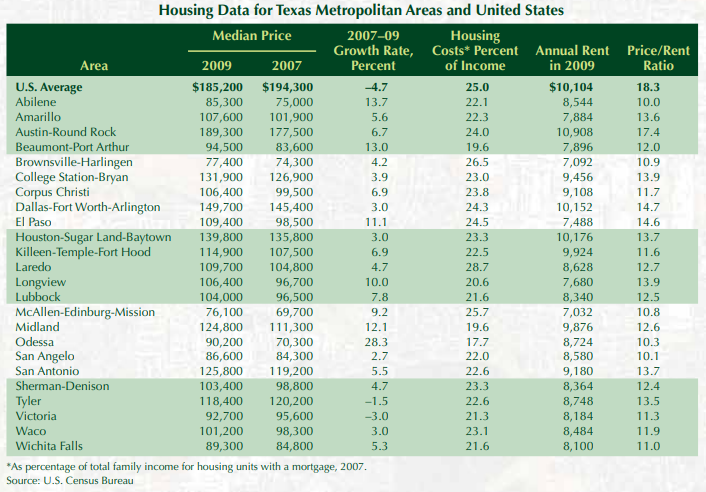
Odessa had the largest percentage of home price appreciation (28.3 percent) followed by Abilene (13.7 percent), Beaumont-Port Arthur (13 percent), Midland (12.1 percent) and El Paso (11.1 percent). Home price appreciation in the Odessa and Midland petroplexes likely was influenced by record high oil prices in 2008 when the price of West Texas intermediate crude oil reached an all-time high of $140.20 per barrel.
The state’s larger metropolitan areas also reported home price appreciation during the Great Recession. Austin-Round Rock experienced the largest increase (6.7 percent) followed by San Antonio (5.5 percent), Dallas-Fort Worth-Arlington (3 percent), and Houston-Sugar Land-Baytown (3 percent).
Housing costs include property taxes, insurance expenses, maintenance costs and mortgage costs. Housing costs as a percentage of total income in all Texas metro areas were lower than the national average of 25 percent, except in BrownsvilleHarlingen (26.5 percent), Laredo (28.7 percent) and McAllenEdinburg-Mission (25.7 percent). The higher than national average percentages of housing costs in these three metro areas mainly reflect lower total family incomes rather than higher housing costs caused by higher home prices.
Odessa housing costs represented the lowest percentage of income (17.7 percent), followed by Midland (19.6 percent), Beaumont-Port Arthur (19.6 percent) and Longview (20.6 percent).
Among the larger metro areas, Dallas-Fort Worth-Arlington had housing costs representing the highest percentage of total family incomes (24.3 percent) followed by Austin-Round Rock (24 percent), Houston-Sugar Land-Baytown (23.3 percent) and San Antonio (22.6), all lower than the national average of 25 percent.
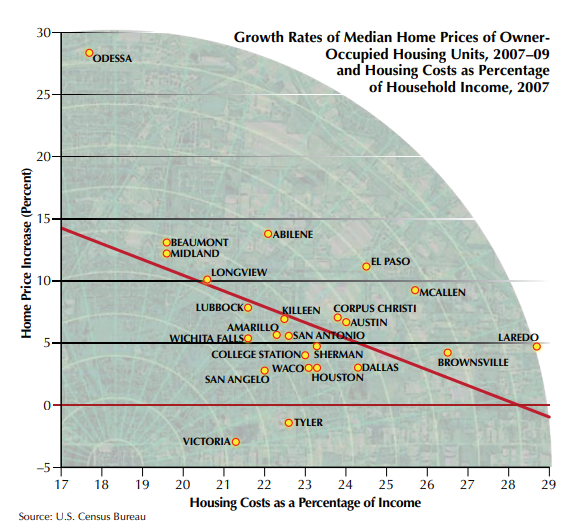
Plotting home price appreciation in the Great Recession against the housing costs as a percentage of total income for Texas metropolitan areas in 2007 reveals a negative relationship between home price appreciation and share of housing costs (see figure). The larger the share of housing costs, the smaller the home price appreciation.
Texas, U.S. Sales-Price-to-Rent Ratios
Sales-price-to-rent ratios for all the state’s metro areas in 2009 were smaller than the national average of 18.3. Austin-Round Rock has the largest price-to-rent ratio (17.4) followed by Dallas-Fort Worth-Arlington (14.7) and El Paso (14.6). San Angelo has the smallest price-to-rent ratio (10.1) followed by Odessa (10.3) and Brownsville-Harlingen (10.9).
Comparisons of housing costs as percentages of family income and price-to-rent ratios for the state’s metropolitan areas with the corresponding national averages once again show that the risk of a major home price decline is low in the foreseeable future and that Texas has a healthy residential real estate market.
Dr. Anari ([email protected]) is a research economist with the Real Estate Center at Texas A&M University.
Did you like this Article?
You might also like

6 minute read
Jul 10 2013
Land, Lots of Land: How Texas Dodged the Housing Bubble
Forget all the references to a “home price” bubble in the mid-2000s. Center research reveals that it was a “land price” bubble that caused havoc in California, Nevada and other states. As for Texas, it flew above the crisis thanks to plentiful land and less restrictive development processes.

5 minute read
Feb 27 2018
Housing Bubble’s 10th Burst-Day
Ten years ago, the United States was in the midst of a subprime-mortgage and ensuing housing crisis. Recessionary pains from the worst downturn since the Great Depression reverberated throughout the country, but a multitude of factors shielded most of the Texas housing market.

Housing
7 minute read
Jan 07 2014
Bubble Vision
Asset price bubbles, including the housing bubble that wreaked havoc in the early 2000s, are hard to predict. Economists can, however, get some insight into bubble formation by studying the relationship between home prices and economic fundamentals such as supply and demand.


