Texas’ housing market, and the U.S. market as well, have hit bottom and rebounded. Consumer interest in buying is on the rise, home prices have leveled out, and inventory of homes for sale is stable.
Oct 15, 2012
Home Improvement
It’s been a long time coming, but the housing market is on its way up. Prices have stabilized, inventory is returning to normal and building permits are on the rise.

America’s housing market is rebounding.
This is a true recovery from the bottom. In economic cycle analysis, a contraction is followed by a bottom, which is followed by a new expansion cycle. The data indicate that Texas has clearly moved from the bottom of the last cycle to the early stages of expansion. The U.S. housing market is improving as well. Several indicators are signaling this.
Buyer Psychology Improving
Americans have been skittish about buying homes for the past few years in light of negative economic news. Their two key worries have been whether or not they will have jobs, and, in Arizona, California, Nevada, Florida and Georgia, significantly declining home prices.
But recent news indicates that residential markets in California and Arizona are rebounding. California sales in May were up more than 11 percent from May 2011. The Phoenix market has strengthened as well, with fewer distressed sales and sales prices up 25.3 percent from a year earlier. May home prices in Orlando were 9 percent higher than a year earlier. The National Association of Realtors reported that nationwide, May sales were up 9.2 percent from May 2011.
Fannie Mae’s national housing survey in May reflected brightened consumer sentiment toward housing. In that survey, 73 percent of respondents said that now is a good time to buy a house. This is the highest level since the survey was inaugurated two years ago. Fully 69 percent said they would buy if they were going to move, an increase of 6 percent from the previous month. The percentage of respondents who said they would rent dropped from 32 percent to 27 percent, the lowest in the survey’s history.
Home Prices Have Stabilized
Home prices as measured by the Standard & Poor’s (S&P)/Case-Shiller Home Price Indices were up 1.3 percent in the 20-city composite index in June. David Blitzer with S&P referred to this increase as a “spike” in prices. Blitzer said, “We are coming back, and this looks like a solid turn.”
Lender Processing Services reported in June that home sales prices were essentially flat. Managing Director Kyle Lundstedt said, “There may be reason to be cautiously optimistic, since we’ve now seen three consecutive months of minor appreciation.”
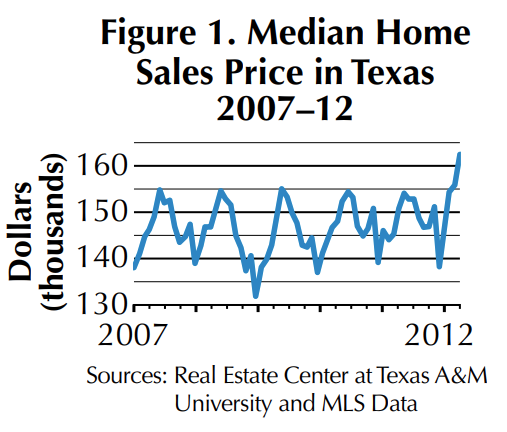
The median price of homes in Texas has been virtually stable for the past five years. But prices have broken out on the upside in the most recent period, reaching $162,400 in May 2012 (Figure 1).
Inventory Normal

Real Estate Center research has determined that for Texas, 6.5 months of inventory of homes for sale is a stable market. When inventory is below 6.5 months, prices increase more rapidly. Inventory greater than 6.5 months causes price increases to slow (Figure 2). When inventory gets into the nine- to 12-month range, prices start falling.
Texas’ inventory of unsold homes stood at six months in May. This suggests stable or even increasing prices going forward.
The number of Texas homes for sale declined significantly in the past two years, from a peak of 147,170 in May 2008 to 108,594 in May 2012. Limited supply can result in competing offers on the same home.
New Home Sales Up Nationally
Lennar Corporation CEO Stuart Miller in June said, “Evidence from the field suggests that the ‘for sale’ housing market has, in fact, bottomed and that we have commenced a slow and steady recovery process.”
The company’s new home orders nationally were up 40 percent in the second quarter.
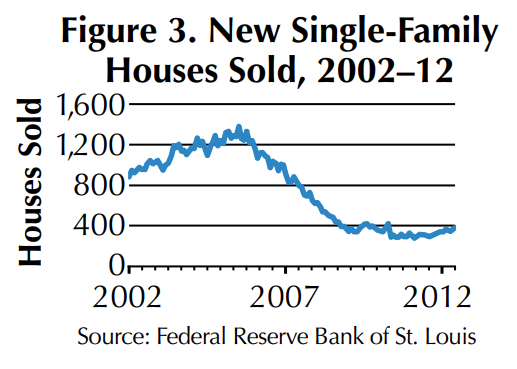
Sales of newly built homes were at a two-year high in May; 369,000 are expected to sell in 2012 (Figure 3). The Wall Street Journal reported in July that the home builder confidence survey recorded the biggest jump since September 2002. New single-family home sales in the United States were up 19.8 percent for the first six months of 2012, compared with the same period in 2011.
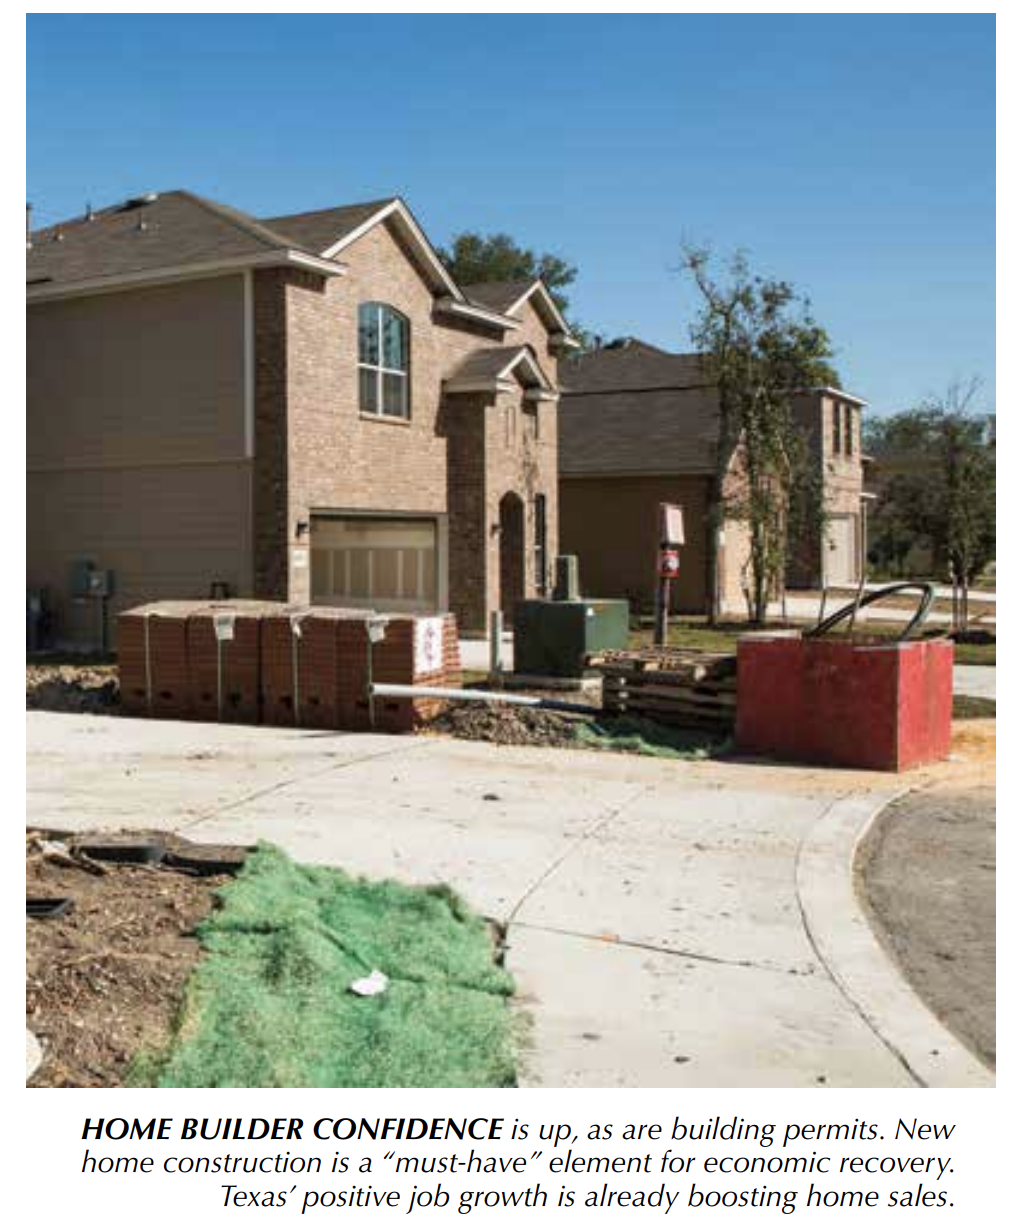
Building Permits Up
Nationally, single-family building permits were up 21.7 percent through May 2012 compared with the same time last year (see table). Texas posted a 20.5 percent increase during that time. New home construction is important to the economic recovery of both Texas and the United States. As homebuilding increases, the economy will continue to recover. Construction jobs have a huge multiplier effect, with positive impacts on retail sales, car sales and industrial warehouse demand.

Existing Home Sales Volume Up
Center research indicates that three variables correlate with home sales volume: job growth, interest rates and home price appreciation. In the past four years, mortgage rates have never been lower, but job growth and home price appreciation prospects have been uncertain.
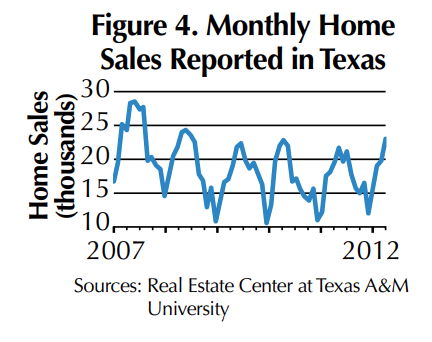
Texas recorded positive job growth, low interest rates and virtually stable prices for the past two years. This resulted in increasing home sales volume, a trend that is continuing in 2012 (Figure 4). For the first five months of 2012, home sales were 13.3 percent higher than the same period in 2011.
What Next?
After languishing for several years, Texas and U.S. housing markets have finally turned the corner. The rebound is likely to be gradual, spanning several years.
Three things have to happen before the housing market grows at a faster pace. First, Congress has to set tax policy so that employers will hire more workers. Second, the pace of foreclosure sales has to pick up. The faster the “shadow inventory” of homes with delinquent mortgages is sold, the better. Third, financial regulators need to tweak Dodd-Frank mortgage regulations so that qualified Americans with less-than perfect credit can buy homes again.
Dr. Dotzour ([email protected]) is chief economist with the Real Estate Center at Texas A&M University.
Did you like this Article?
You might also like


8 minute read
Aug 31 2020
Anatomy of a Pandemic
Assessing Housing Market Damage and Recovery
Like the rest of the economy, Texas’ housing market will need more than bed rest and a couple of aspirin to fully recover from COVID-19, but so far it has weathered the pandemic better than expected. Read our prognosis.


