Even down times have an upside. Decreasing home prices, the higher volume of foreclosed homes available, tougher mortgage lending standards and reluctant buyers are combining to make Texas homes more affordable than anywhere in the United States.
Jan 8, 2010
Housing Affordability Upswing
Good news is in short supply these days. But amidst nationwide economic woes, homes are actually more affordable thanks to low mortgage rates and depressed prices.

Under normal conditions, we expect the housing market to boom when home prices are in line with household incomes, mortgage interest rates are at historically low levels and the supply of properties for sale is plentiful.
Right now these favorable conditions generally prevail everywhere, but the housing market remains in one of its most serious busts.
Sales of new and existing homes are at historic lows because of severe job losses, a high volume of distressed-property offerings, tight mortgage underwriting standards that limit credit availability and depressed buyer morale. Nationally, home prices have fallen around 30 percent since their peak in mid 2006. Foreclosures could surge in 2010 with job losses and as massive numbers of prime adjustable-rate mortgages reset, pushing home values even lower.
Perhaps the only bright spot in the current housing bust is the substantial improvement in overall housing affordability throughout the country. Decreasing home prices are increasing affordability throughout the country. Ultimately, lower home prices may stimulate buyers and stabilize the housing market.
The significant rise in the National Association of Realtors’ (NAR) monthly composite affordability index reflects the wide swing in overall housing affordability during this decade (Figure 1).
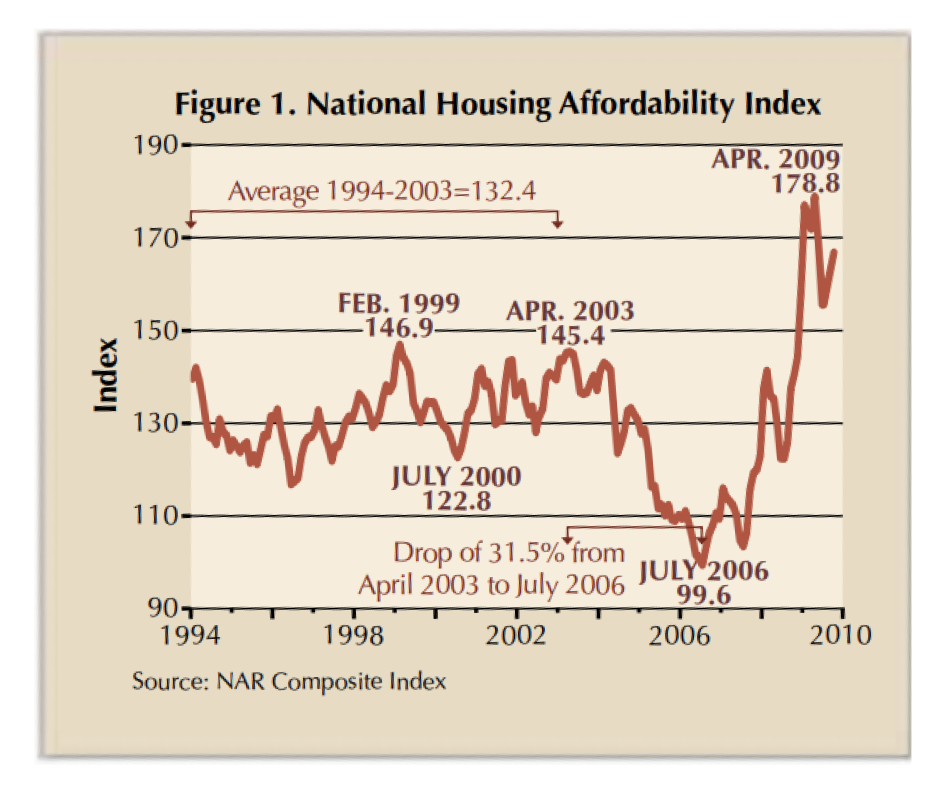
The affordability index measures whether a typical family could qualify for a mortgage loan on a typical home. The typical home is defined as the national median-priced home, and the typical family as one that earns the median family income.
An index value of 100 means a family with the median income has exactly enough to qualify for a loan to buy the median-priced home at the prevailing 30-year fixed interest rate with a 20 percent down payment and a 25 percent qualifying ratio (monthly mortgage payment does not exceed 25 percent of gross monthly income).
From 1994 through 2003, the index averaged 132.4 (Figure 1). It reached 146.9 in February 1999 and 145.4 in April 2003. Then in July 2006, at the height of the recent housing boom, the index fell 31.5 percent to a low of 99.6. As home prices began falling in late 2006, the affordability index increased dramatically from the July 2006 low point to a record high 178.8 in April 2009.
Affordability shrank substantially between 2004 and mid-2006. The median home price escalated to record highs and mortgage interest rates increased from 5.5 percent to 6.76 percent between March 2004 and July 2006. Since then, affordability has skyrocketed as prices and mortgage rates have fallen.
Overlaying the national median existing home price and the Federal Home Loan Mortgage Corporation (FHLMC) 30-year fixed rate on top of the affordability index depicts how the index moves inversely to changes in home prices and interest rates (Figure 2). As the median home price and mortgage rates increased, affordability decreased. More recently, as median home price and mortgage rates have fallen, affordability has reached new highs.


Texas has maintained a comparative advantage relative to most other states and is the most housing affordable highgrowth state. The median price of a home in Texas is lower than the national average and other major growth states’ median prices, but the differential is closing (Figure 3).
Texas avoided the housing price bubble that affected the nation between 2003 and 2007. The bubble is easy to see in the national median price series. The gap between Texas’ median home price and the national median peaked at 38 percent in 2005 but has since closed more than halfway to around 16 percent. The gap narrowed because Texas home prices have not dropped as much as those elsewhere in the nation. Current estimates of median prices indicate the gap probably stayed about the same for 2009.
Another standard affordability measure is the ratio of median home price to median income. The price to income multiple provides a general gauge of overall affordability. In its annual report on the U.S. housing market, the Joint Center for Housing Studies of Harvard University reported that among the 122 metro areas covered by NAR, the number of areas where the ratio is less than 3.0 is now roughly equivalent to 2003 levels.
A well known rule of thumb is that a family should be able to pay 2.5 to 3.0 times its annual income for a home. This rule applies when mortgage interest rates are in the 6 percent to 7 percent range. A price greater than three times annual gross earnings would be considered too high because the monthly payment for a typical conventional 80 percent fixed-rate mortgage would put too great a financial burden on the homeowner.
As mortgage interest rates fall, the affordable multiple of income increases as households are able to buy a higher-priced home for the same monthly payment.
The price-to-income ratio between 1989 and 2000 averaged 4.1 for new homes in the United States, 3.5 for existing homes and 2.6 for all homes in Texas (Figure 4). The pattern of the price-to-income ratio during the past 20 years indicates how the market peaked from 2004 to 2006 but appears to be reverting to normal.

In 2005, at the peak of the market, buyers nationally were paying 5.2 times their annual income to purchase a new home and 4.8 times their income to acquire an existing home because low interest rate loans were easier to obtain. From 2004 to 2007, in some areas of California, purchasers had to pay as much as ten times their incomes or more. These buyers were dependent on the most exotic financing schemes offered by lenders.
The 2008 ratios in Figure 4 were estimated using the 2007 median household income for Texas and the United States multiplied by the average growth rate during the past 23 years. Given the current economic climate, achieving this rate of increase is problematic. If the actual income growth turns out to be less, the ratio will be higher. Generally, Texas housing affordability stayed within reasonable bounds, peaking at 3.3 in 2005 and 2006 and falling back toward 3.0.
The Texas Housing Affordability Index (THAI) calculated by the Real Estate Center at Texas A&M University for selected state metro areas indicates that homes have remained affordable everywhere in Texas since the beginning of the last housing cycle. The table shows the computed THAI for the 45 Texas metropolitan areas surveyed.
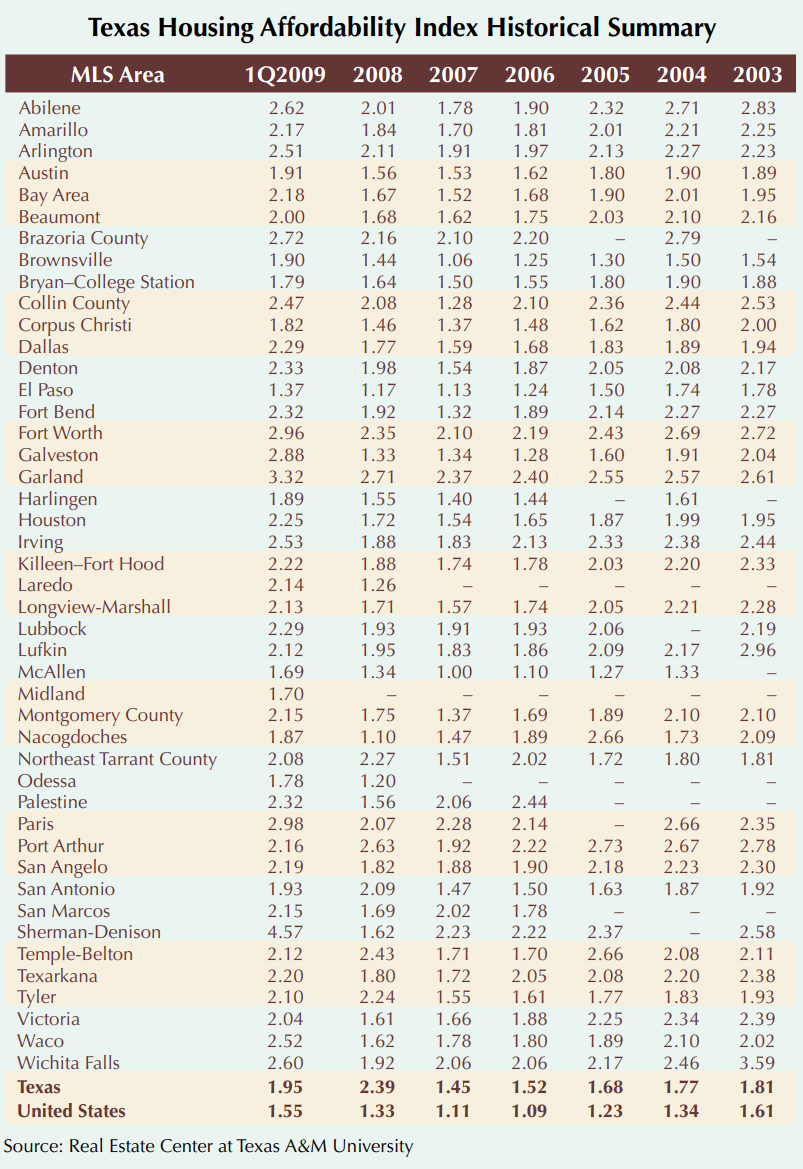
The THAI employs the same financial assumptions in the same manner as the NAR index except for median income. The Center’s index uses the Housing and Urban Development median family income estimate for each fiscal year as the income basis rather than calculating a quarterly household income estimate.
All of the metro areas in Texas maintained high levels of affordability even during the main thrust of the housing boom, primarily because home prices did not artificially inflate.
With mortgage interest rates at historically low levels and a large supply of available properties for sale, affordability for the next several years should be at a favorable level for households that can qualify for financing.
Dr. Gaines ([email protected]) is a research economist and Thomas ([email protected]) is a research assistant with the Real Estate Center at Texas A&M University.
Did you like this Article?
You might also like

2 minute read
Feb 23 2023
Texas Housing Affordability Outlook
Affordability continued to decline in 4Q2022 amid higher mortgage interest rates and still-elevated home prices. Although home price appreciation declined substantially from record highs observed in the first two years of the COVID-19 pandemic.


