A key macroeconomic concept — nonaccelerating inflation rate of employment — can be used to determine whether home prices in an area will go up or down.
Jan 20, 2008
How Inventory Affects Housing Prices
Economic theory suggests that when inventory of homes for sale falls below a “natural” level, prices will rise.

What’s ahead for the housing market? With so many variables in play — the subprime mortgage meltdown, the Fed’s monetary policy, and the U.S. economy in general — how will prices react? Studying the relationship between home price appreciation and inventory of homes for sale sheds light on trends in different regions.
The concept of nonaccelerating inflation rate of unemployment (NAIRU) was introduced by renowned economist Milton Friedman in 1968. According to NAIRU, there is an unemployment rate associated with a stable inflation rate. Inflation is expected to accelerate if the unemployment rate falls below this natural rate.
For instance, if NAIRU is 5 percent and unemployment and inflation are at 6 percent and 3.2 percent, respectively, inflation can be expected to fluctuate around the 3.2 percent level as long as the unemployment rate remains above its natural rate. If unemployment falls below 5 percent, inflation would be expected to rise, perhaps to 4 percent or more.
Like most economic theories, NAIRU’s conceptual foundations and empirical applications have been widely debated. The NAIRU theory has survived harsh scrutiny and is now employed as an analytical framework for research on prices in various markets, including real estate.
Inflation rate and unemployment rate in macroeconomics are conceptually similar to price appreciation and the unsold property inventory in real estate. Applying NAIRU to real estate (specifically residential markets) suggests there is a natural inventory of homes for sale below which home price appreciation is expected to accelerate.
Measuring Natural Homes-for-Sale Inventory
Estimating the natural inventory of homes for sale can be done in several ways. One method is to analyze graphs showing changes in home prices and the corresponding inventories of homes for sale in an area.
Another method, the one used in this research, is statistical analysis or econometric analysis of time series of home prices and inventories.
Home price appreciation is a result of the general inflation level and the supply and demand conditions reflected in the inventory of homes for sale. The first step in computing natural inventory of homes for sale is to remove the effects of general inflation from home prices. For this purpose, the time series of home prices should be adjusted for inflation. That is, home prices are divided by an appropriate index of inflation.
The Federal Reserve Bank of Dallas compiles several consumer price indexes, including the consumer price index minus shelter for the Dallas and Houston metropolitan areas. This is the most appropriate index to use for removing the effects of inflation on home prices. Dividing the actual (also called nominal) time series of home prices by one of these indexes gives the time series of home prices in real terms.
Next, an equation representing the relationship between changes in real home prices and inventory level is estimated by regressing the time series of changes in real home prices on a constant term and on inventory level. The natural level of inventory is computed by dividing the estimated constant term in the equation by the estimated coefficient of the inventory variable.
Texas’ Natural Inventory
Actual inventory, natural inventory and annual rates of home price appreciation for Texas from 1989 to 2006 are shown in Figure 1. Before 1993, the actual levels of inventory were above the natural level. As actual inventory gradually fell to the natural level, the state’s residential market experienced higher rates of home price appreciation. Since 1993, actual inventory has been lower than natural inventory and higher (lower) home price appreciation has been associated with the larger (smaller) gap between actual inventory and natural inventory.
More recently, while the level of inventory has fallen from 6.1 months in 2003 to five months in 2006, the rate of average annual home price appreciation has increased from 2.4 percent to 5.6 percent (Figure 1).

Latest home sales data show that in July 2007 the inventory of homes for sale in Texas was six months. As this is less than the natural inventory of 8.7 months, it is likely that the state’s residential market will continue to see home price appreciation.
Differences in Major Texas MSAs
Natural inventories of homes for sale differ from one area to another because buyer responses to the supply of homes for sale and inventories of homes vary. From 1990 to 2006, the inventory of Austin housing units increased 78 percent compared with 42 percent for Dallas and 37 percent for Houston.
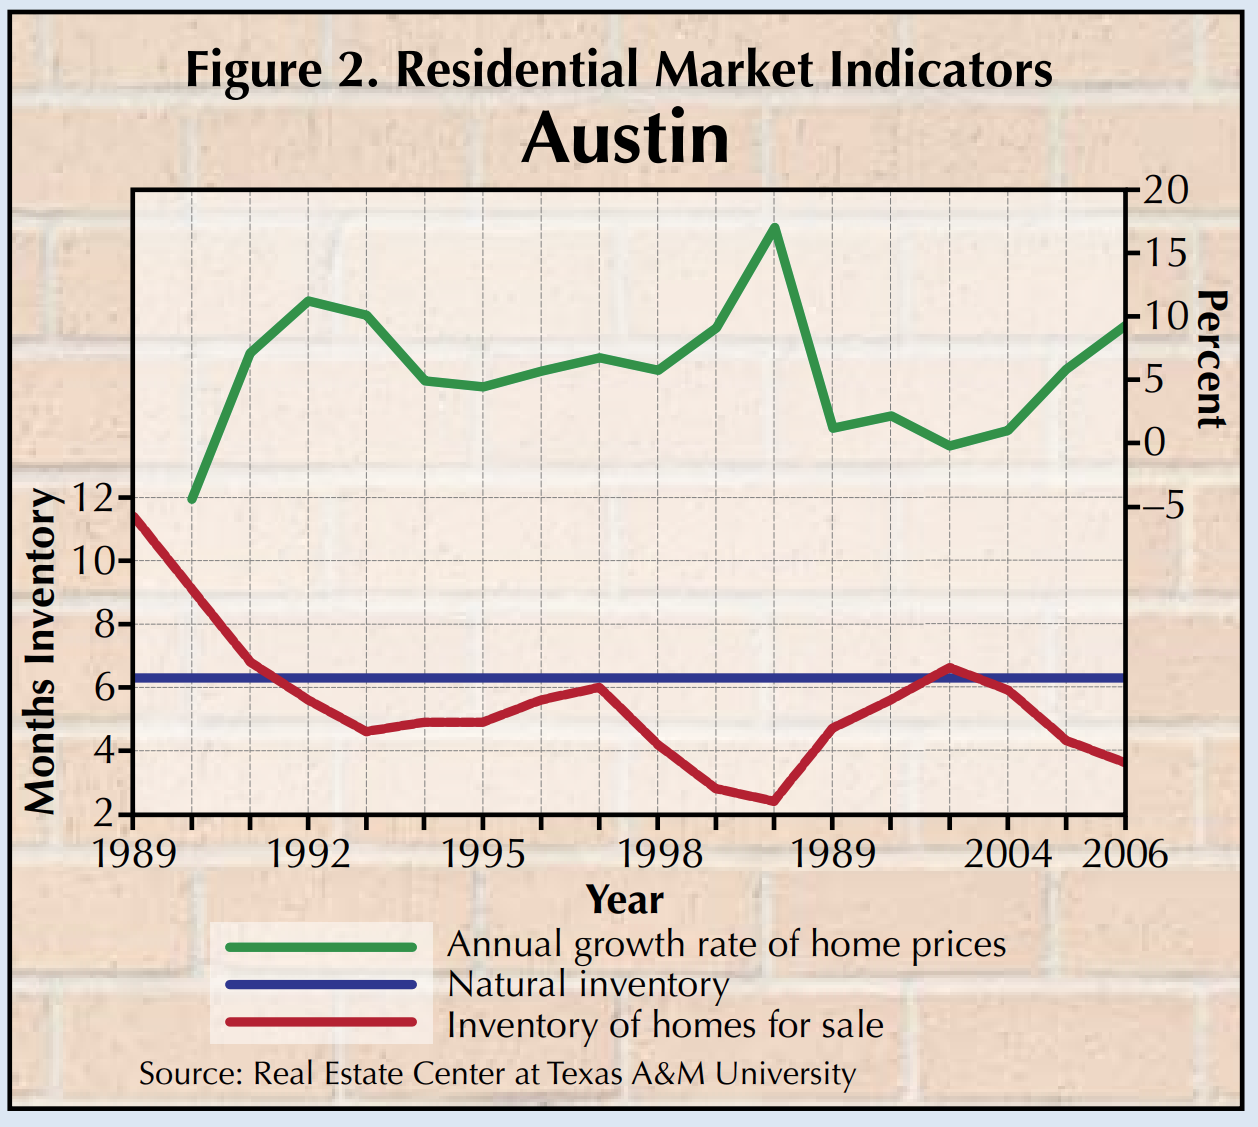
The actual inventory of homes for sale in Austin was near the natural level of 6.3 months in 1991, 1997 and 2003 (Figure 2). Actual inventory fell to 3.6 months in 2006 associated with a home price appreciation of 5.8 percent in 2005 and 9.2 percent in 2006. In July 2007, inventory of homes for sale in Austin stood at 4.3 months, well below 6.3 months, suggesting that home price appreciation in the metro area will continue.
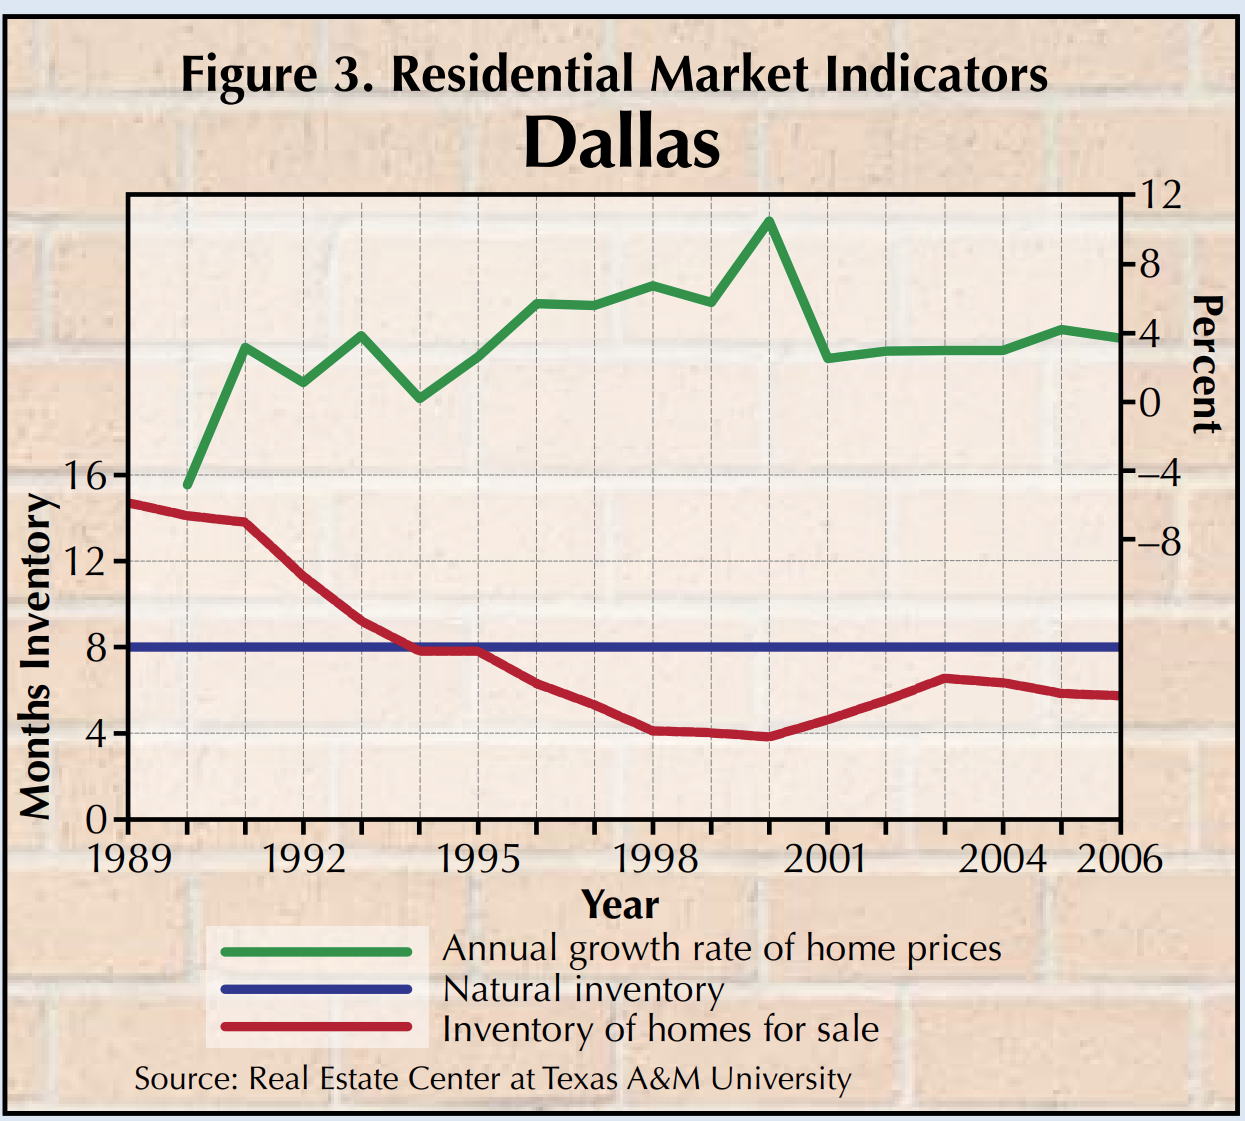
In the Dallas metro area, actual inventory of homes for sale fell from 14.7 months in 1989 to its natural level of eight months in 1994–95 (Figure 3). Actual inventory fell from 6.5 months in 2003 to 5.7 months in 2006, resulting in mild price appreciation of 4.2 percent in 2005 and 3.8 percent in 2006. The latest home sales data for Dallas show a 6.7-month actual inventory of homes for sale in July 2007, which is still below the area’s natural level. Home price appreciation from July 2006 to July 2007 was 3 percent.
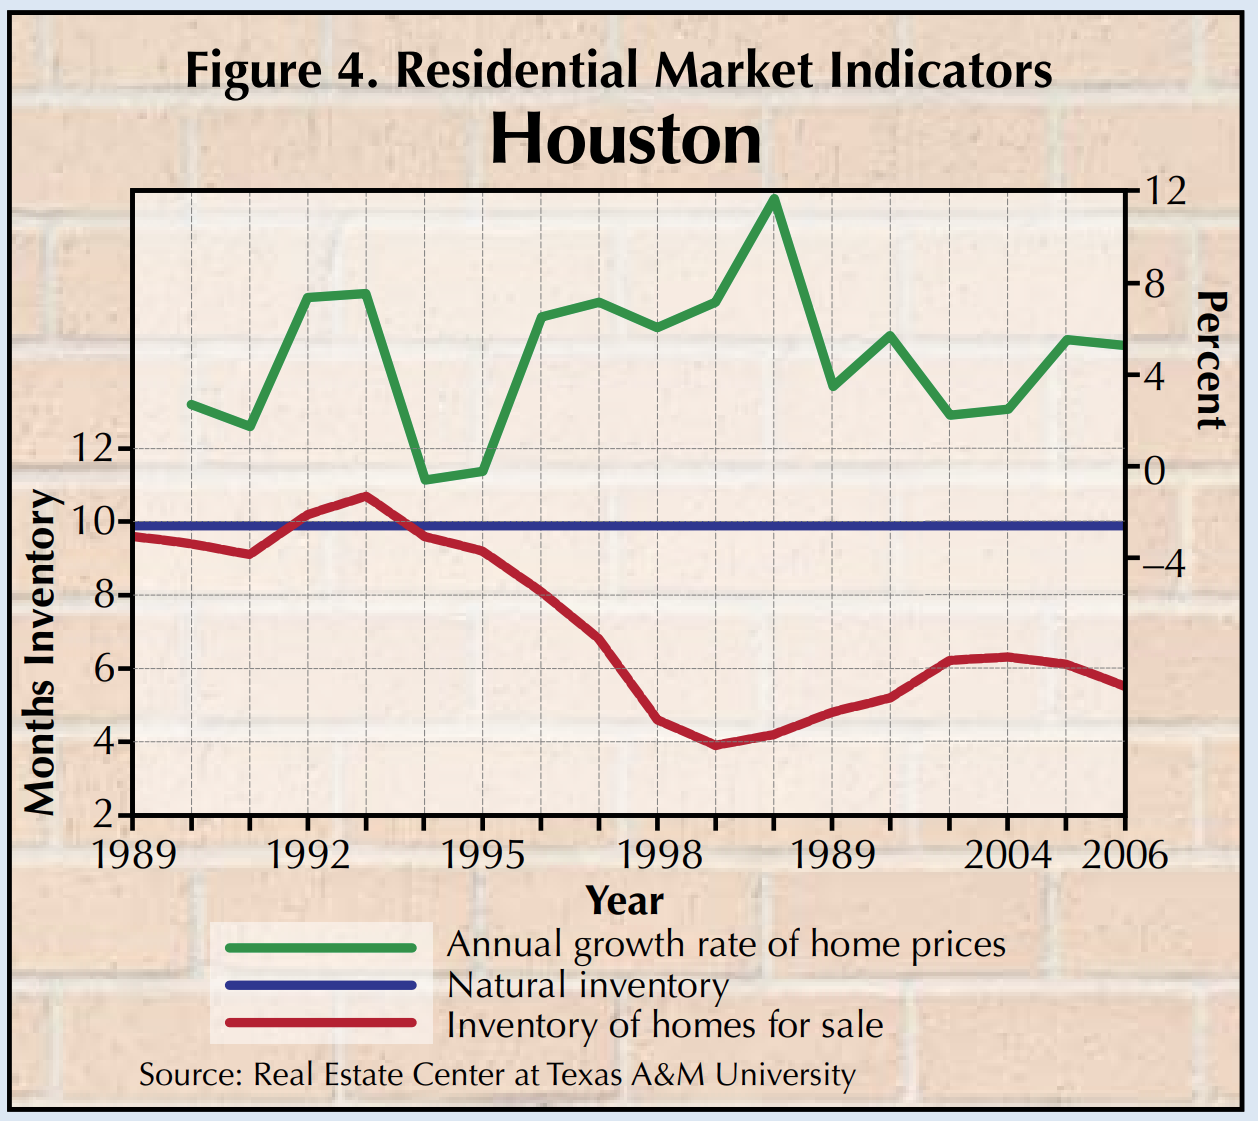
The Houston metro area’s actual inventory was around its natural level of 9.8 months from 1989 to 1994 and fell to 3.9 months in 1999, corresponding with a home price appreciation rate of 29.6 percent (Figure 4). The gap between actual and natural inventories of homes for sale began to narrow in 2000, and home price appreciation rates in the area have moderated. In July 2007, the inventory of homes for sale in the Houston area stood at 6.4 months. Home prices appreciated 2.8 percent from July 2006 to July 2007.
When using natural homes-for-sale inventory for forecasting home price appreciation, it is important to remember that there are lags in the relationships between home price appreciation and inventory levels. The effects of changes in inventory occurring in one period may be reflected in home prices in later periods.
Dr. Anari ([email protected]) is a research economist with the Real Estate Center at Texas A&M University.
Did you like this Article?
You might also like


5 minute read
Aug 07 2017
Is Something Wrong with Texas Home Prices?
Since 2012 Texas housing prices have been rising faster than incomes. Rapid home price increases affect the stability of the fundamental relationship between income, demand and supply, and home prices. Home price increases should be based on fundamentals.


