Texas Housing Insight | July 2024
July saw an increase in home sales and a sharp rise in building permits. The previous month’s decline was partly due to fewer business days, which led to a spillover of activity in July.

All measurements are calculated using seasonally adjusted data, and percentage changes are calculated month-over-month, unless stated otherwise.

July saw an increase in home sales and a sharp rise in building permits. The previous month’s decline was partly due to fewer business days, which led to a spillover of activity in July. New listings fell almost 10 percent, but active listings fell by less than 1 percent, possibly due to the counteracting increase in sales for the month.
Home Sales Take Major Jump in July
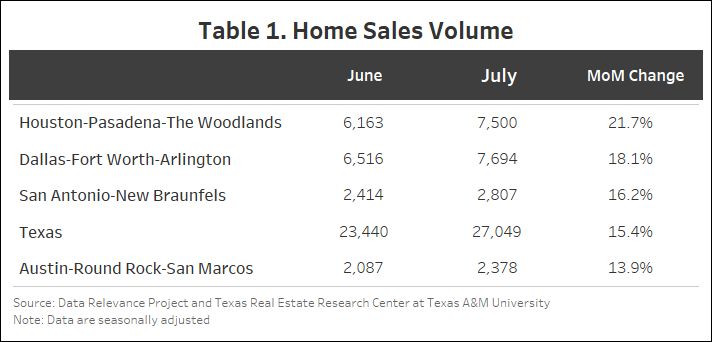
Texas bounced back over June’s low sales with a 15.4 percent month-over-month (MOM) increase in seasonally adjusted home sales in July, resulting in 27,049 homes sold (Table 1). Houston experienced the largest increase among the Big Four at 21.7 percent (7,500), followed by Dallas (7,595) and San Antonio (2,807), which increased by 18.1 and 16.2 percent, respectively. Austin had the lowest sales change of the Big Four with a 13.9 percent increase, resulting in 2,378 homes sold in July.
New listings fell by more than 4,000, a 9.8 percent drop from June. Houston, with 9,739 listings representing a 24.7 percent drop, was a major contributor to this decline, followed by Austin with 2,853 listings (18.8 percent drop). San Antonio (4,041) and Dallas (9,774) also experienced similar declines of 14 and 12 percent, respectively. Overall, the Big Four is seeing a downward shift in new listings that had been on the rise until April 2024, when they hit their high for the year so far.
The state’s average days on market (DOM) remained unchanged at 59 days in July. San Antonio had the largest decrease—73 to 71 days, a 2 percent decline. Similarly, Austin dropped from 68 to 67 days. Dallas and Houston, on the other hand, have not shown any major changes.
Texas’ number of active listings went down from 116,335 to 115,865 (0.4 percent). Active listings across the Big Four were mixed in July with Dallas, San Antonio, and Austin increasing by 4.7 percent (26,013), 2.4 percent (13,907), and 2 percent (11,426), respectively, while Houston fell 8.5 percent (27,503).
Statewide pending listings in Texas have been on the decline since earlier this year with 4,292 fewer pending listings in July than in February, when they peaked at 29,274. San Antonio and Houston had the highest declines—8.4 percent (to a current 2,515) and 7 percent (6,686), respectively. Dallas had a smaller decline of 2.9 percent (6,837) while Austin (2,355) hasn’t had any major changes.
Interest Rates Dip Slightly
Treasury and mortgage rates both declined in July but at a slower rate than the month before. The average ten-year U.S. Treasury Bondyield fell 6 basis points to 4.25 percent. The Federal Home Loan Mortgage Corporation’s 30-year fixed-rate fell by 7 basis points to 6.85 percent.
Single-Family Permits Bounce Back, but Starts Fall
Texas’ monthly building permits bounced back in July, increasing 26.3 percent MOM after dropping 19 percent in June. All Big Four metros had growth except for San Antonio, which fell by 12.3 percent. Austin and Dallas grew the most at 28.3 percent and 71 percent, respectively. Both almost reached the April high point. Houston, however, failed to grow at the same rate as the others, rising only 6 percent.
Single-family construction starts have been on the decline since March 2024. Seasonally adjusted statewide single-family starts decreased by 4.3 percent MOM to 12,542 units. The Big Four have been in decline with Houston leading at 12 percent, San Antonio at 6 percent, and Dallas at 1.8 percent. Austin has been relatively steady with only a 1 percent fall.
The state’s total value of single-family starts climbed from $17.39 billion in July 2023 to $22.91 billion in July 2024. Houston accounted for 35.7 percent of the state’s total starts value followed by Dallas with 27.1 percent.
Home Prices Increase Slightly
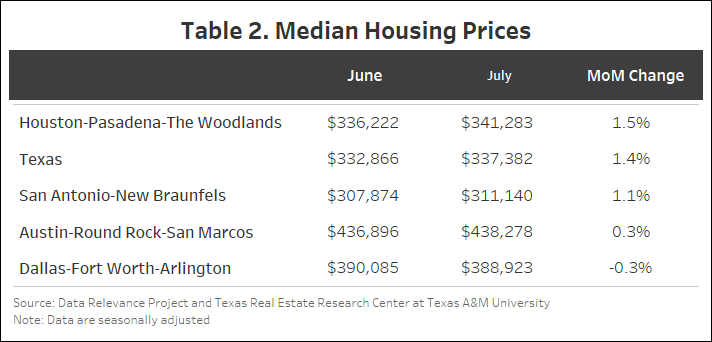
Texas’ median home price rose 1.4 percent MOM in July from $332,866 to $337,382. Houston rose by 1.5 percent at $341,283 while San Antonio rose by 1 percent at $311,140. Austin rose by 0.3 percent. Dallas was the only one among the Big Four that had a slight decline of 0.3 percent.
The Texas Repeat Sales Home Price Index (Jan 2005=100), which is a more accurate reflection of home price changes, fell 0.3 percent MOM in July but increased 1.4 percent year over year (YOY). Austin’s annual appreciation remains below the state’s average and fell by 3.2 percent YOY in July.
You might also like


How Natural Disasters Affect Homebuying Decisions
The combination of climate change and economic growth in disaster-prone regions increasingly exposes Texas’ population to extreme weather events (IPCC, 2023). Natural disasters have an immediate impact on economic activity and typically lead to net out-migration, decreased income, and lower real estate values (Boustan et al., 2020).

String of Perils
Breaking news: Insurance is complicated. This guide to the different types of perils, policy forms, and coverage types can help you better understand your choices for property coverage and make informed decisions.


