


Texas Housing Insight | June 2024
Housing activity for both new and existing homes decreased considerably in June. Growth in active listings resulted in downward pressure on home prices. Seasonally adjusted home prices dipped 1.5 percent, which is uncharacteristic for June when housing activity normally peaks for the year.

All measurements are calculated using seasonally adjusted data, and percentage changes are calculated month-over-month, unless stated otherwise.

Housing activity for both new and existing homes decreased considerably in June. Growth in active listings resulted in downward pressure on home prices. Seasonally adjusted home prices dipped 1.5 percent, which is uncharacteristic for June when housing activity normally peaks for the year.
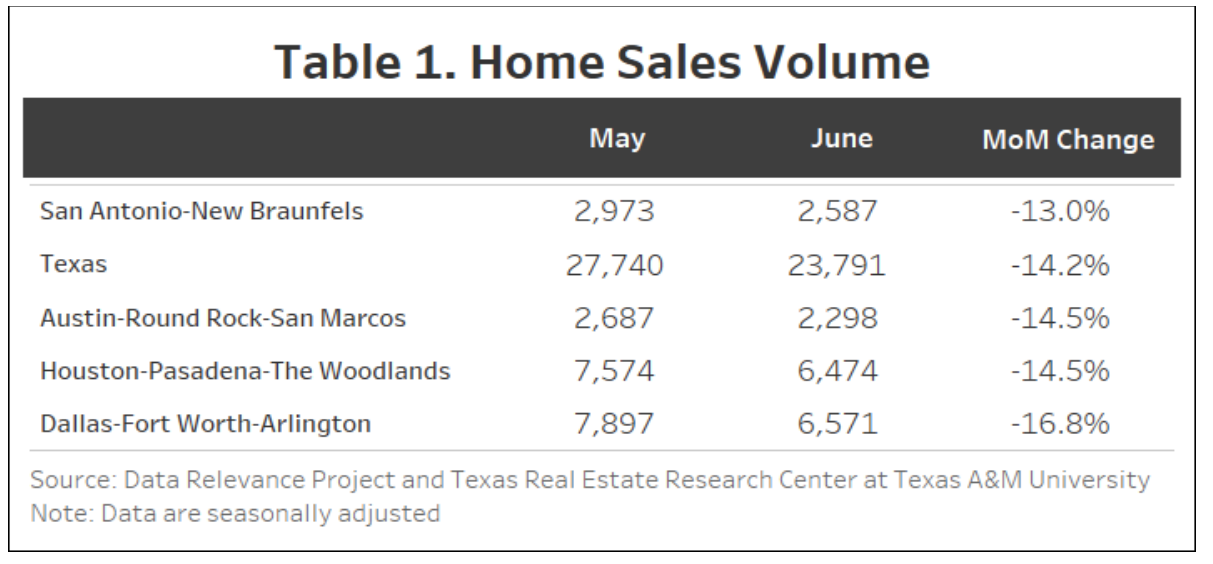
Home Sales Take Major Downhill Slide in June
Texas witnessed a 14.2 percent month over month (MOM) decrease in seasonally adjusted home sales in June, resulting in 23,791 homes sold (Table 1). Dallas experienced the largest decrease among the Big Four at 16.8 percent (6,571) followed by Houston (6,474) and Austin (2,299), which each fell by 14.5 percent. The decline in San Antonio was relatively minimal, at 13 percent (2,587). As of June, year-to-date home sales are at the same levels as last year.
Recent data indicate a shift in new listings following a period of steady growth, notably led by Austin among the major metropolitan areas, which experienced a 13.6 percent decline to 3,513 listings. While all Big Four cities saw decreases, Austin’s decline was the most pronounced. Houston and San Antonio saw reductions of 3.8 percent (12,919 listings) and 2.4 percent (4,692 listings), respectively. Dallas exhibited the least variation, with a modest decrease of 1.2 percent (10,852 listings).
The state’s average days on market (DOM) increased from 57 to 59. Austin and Houston each increased by three days and are currently at 68 and 50 days, respectively. San Antonio and Dallas each increased by two days. San Antonio had the highest days on market among the Big Four with 74 days. Dallas had an average of 51 days.
The number of Texas active listings went up from 113,714 to 116,797 (2.7 percent). The active listings across the Big Four were mixed in June with Houston increasing by 15.7 percent (30,179) while Dallas fell 9.7 percent (24,557). San Antonio and Austin had relatively smaller increases of 2.5 percent (13,576) and 0.3 percent (11,407), respectively.
Statewide pending listings in Texas have been on a decline since February with only a slight increase of 0.3 percent in June. San Antonio and Dallas both decreased by 10 percent and are currently at 2,459 and 6,493, respectively. Houston and Austin increased by 8 percent (7,592) and 4 percent (2,464), respectively. The slowdown in sales and pending listings in San Antonio and Dallas have contributed to their higher than-normal active listing count.
Housing Highlight
Part of this month’s broad-based sales decline is explained by the fact that there were only 20 business days in June—the fewest since April 2023. The pattern of the calendar resulted in three fewer business days relative to last month and two fewer business days relative to June 2023. In percentage terms, June 2024 had 9 percent fewer business days than June 2023 and 13 percent fewer than May 2024. An additional two business days would have yielded 3,000 more closed listings across the state and reflected a YOY contraction closer to 3 percent (as opposed to the 12 percent drop that occurred in June). Since there were fewer business days in June, there will be an extra two business days in July (relative to last year), providing a tailwind for monthly sales figures on top of recent drops in mortgage rates.
Interest Rates Dip Slightly
Treasury and mortgage rates both declined in the month of June but was not enough to positively influence housing sales. The average ten-year U.S. Treasury Bond yield fell 17 basis points to 4.31 percent. The Federal Home Loan Mortgage Corporation’s 30-year fixed-rate fell by 14 basis points to 6.92 percent.
Single-Family Permits Follow Sales Decline
Texas state monthly building permits plummeted 18.9 percent MOM in June reaching 10,977. The Big Four faced a comprehensive decline to varying degrees. The decrease in Austin was the most significant, reaching 30.1 percent. Dallas also experienced a substantial drop, with a decrease of 20.1 percent. Houston and San Antonio had smaller declines of 7.1 and 7.7 percent, respectively.
Single-family construction starts also declined but to a much lesser degree according to data from Dodge Construction Network. Seasonally adjusted statewide single-family starts decreased by 0.3 percent MOM to 13,198 units. Austin had a slower month for permits with a decline of 3.2 percent. DFW actually increased 2.8 percent over May, reaching 3,566 starts. Houston and San Antonio had a slight increase of 0.4 and 0.1 percent, respectively.
The state’s total value of single-family starts climbed from $14.68 billion in June 2023 to $20.06 billion in June 2024. Houston accounted for 36.3 percent of the state’s total starts value followed by Dallas with 26.8 percent.
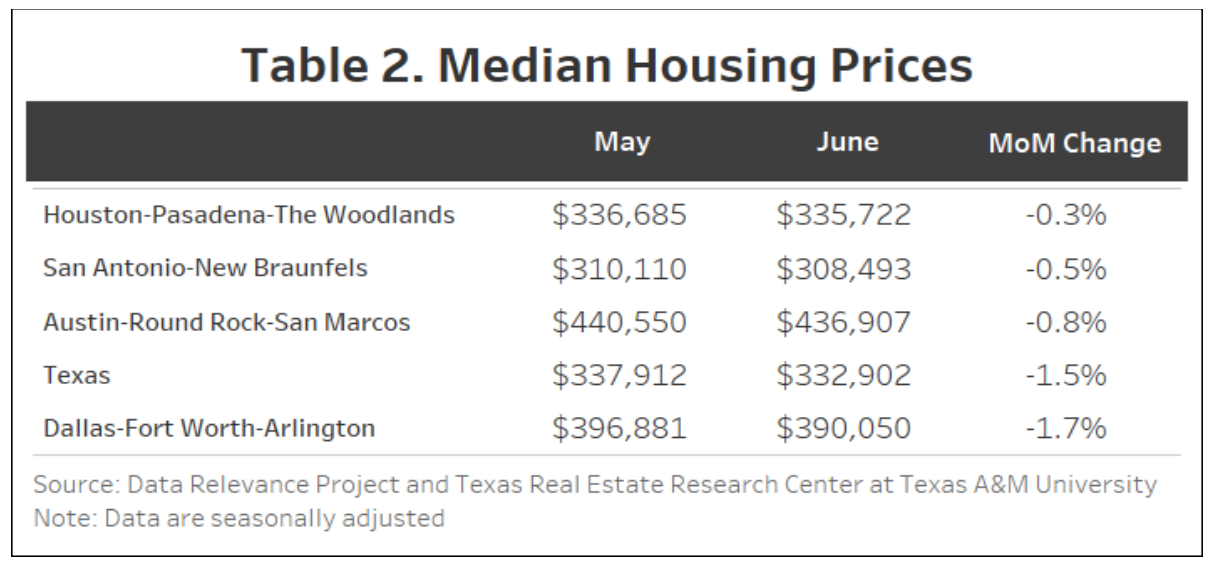
Home Prices Decline
Texas’ median home price fell by 1.5 percent MOM in June with an overall decline in the Big Four areas (Table 2). Houston, San Antonio, and Austin each declined by less than one percent. Dallas experienced the largest decline, with a drop of 1.7 percent, surpassing the overall state decline. For a better understanding of repeat sales from the median approach, see Texas Home Price Index Explained – REC 101.
The Texas Repeat Sales Home Price Index (Jan 2005=100), which is a more accurate reflection of home price changes, fell 0.4 percent MOM in June but increased 1.4 percent year over year (YOY). Austin’s annual appreciation remains below the state’s average and fell by 1.5 percent YOY in June.
You might also like


How Natural Disasters Affect Homebuying Decisions
The combination of climate change and economic growth in disaster-prone regions increasingly exposes Texas’ population to extreme weather events (IPCC, 2023). Natural disasters have an immediate impact on economic activity and typically lead to net out-migration, decreased income, and lower real estate values (Boustan et al., 2020).

String of Perils
Breaking news: Insurance is complicated. This guide to the different types of perils, policy forms, and coverage types can help you better understand your choices for property coverage and make informed decisions.

TG Magazine
Check out the latest issue of our flagship publication.