Skip Navigation
Jun 8, 2015

Texas Job Market Outpaces Nation’s

In the post-Great Recession race to create jobs, Texas did itself proud. It beat the nation as a whole.

2104-hero
By
Ali Anari

An ongoing research program at the Real Estate Center monitors the performance of the Texas economy visร -vis the U.S. economy and other state economies in the aftermath of the Great Recession. An article in the April 2015 Tierra Grande compared the Texas economyโ€™s recovery with the U.S. economyโ€™s measured in terms of gross domestic product. This article reports findings regarding Texasโ€™ share of U.S. job recovery since the end of the Great Recession.

The Great Recession (GR) was the largest economic downturn since the Great Depression. According to the Business Cycle Dating Committee of the National Bureau of Economic Research, it began in December 2007 and ended in June 2009. During this period, the U.S. economy lost 3.1 percent of its aggregate output measured in terms of gross domestic product (GDP) adjusted for inflation. But job losses were even more severe. From January 2008 to December 2009, the U.S. economy lost 8.7 million jobs or 6.3 percent of total nonfarm jobs.

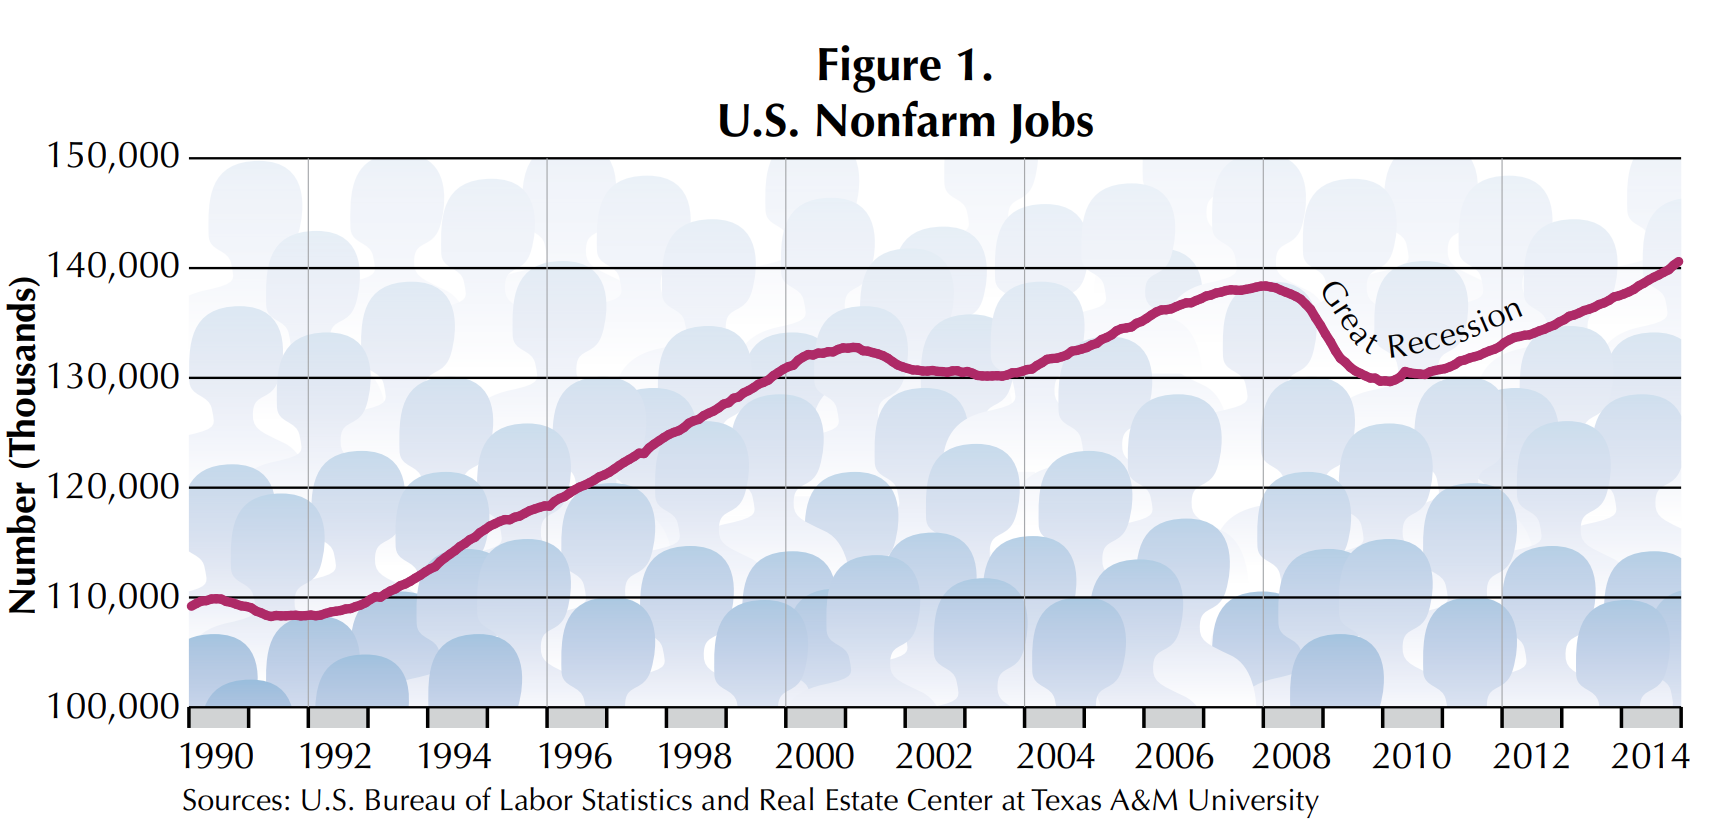
Since December 2009, the U.S. economy has had a slow and modest labor market recovery. It took about six years to recover jobs lost in the GR. In May 2014, the U.S. economy reached its prerecession peak of more than 138 million jobs (Figure 1). The most recent employment data show that the nation gained more than 10.9 million jobs from December 2009 to December 2014.

Figure 1. U.S. Nonfarm Jobs is a line graph with a red line representing the number (in thousands) of U.S. nonfarm jobs. Source is the U.S. Bureau of Labor Statistics and Real Estate Center at Texas A&M University.

The GR was less severe in Texas than in the United States as a whole. Along with half a percent of its GDP, the state lost 431,000 or 4.1 percent of nonfarm jobs from a pre-GR peak in August 2008 to the trough in December 2009 (Figure 2). It took about two years, until November 2011, for Texas to recover jobs lost in the GR.

Figure 2. Texas Nonfarm Jobs, similar to the previous line graph has a red line representing the number (in thousands) of nonfarm jobs in Texas from 1990 to 2014. Source is the U.S. Bureau of Labor Statistics and Real Estate Center at Texas A&M University.

This โ€œTexas sizedโ€ job recovery has been playing an important role in the nationโ€™s labor market recovery from the GR. The Texas economy has created more than 1.539 million jobs since December 2009, a 15.1 percent growth rate, ranking first among U.S. states in job growth rate (Table 1).
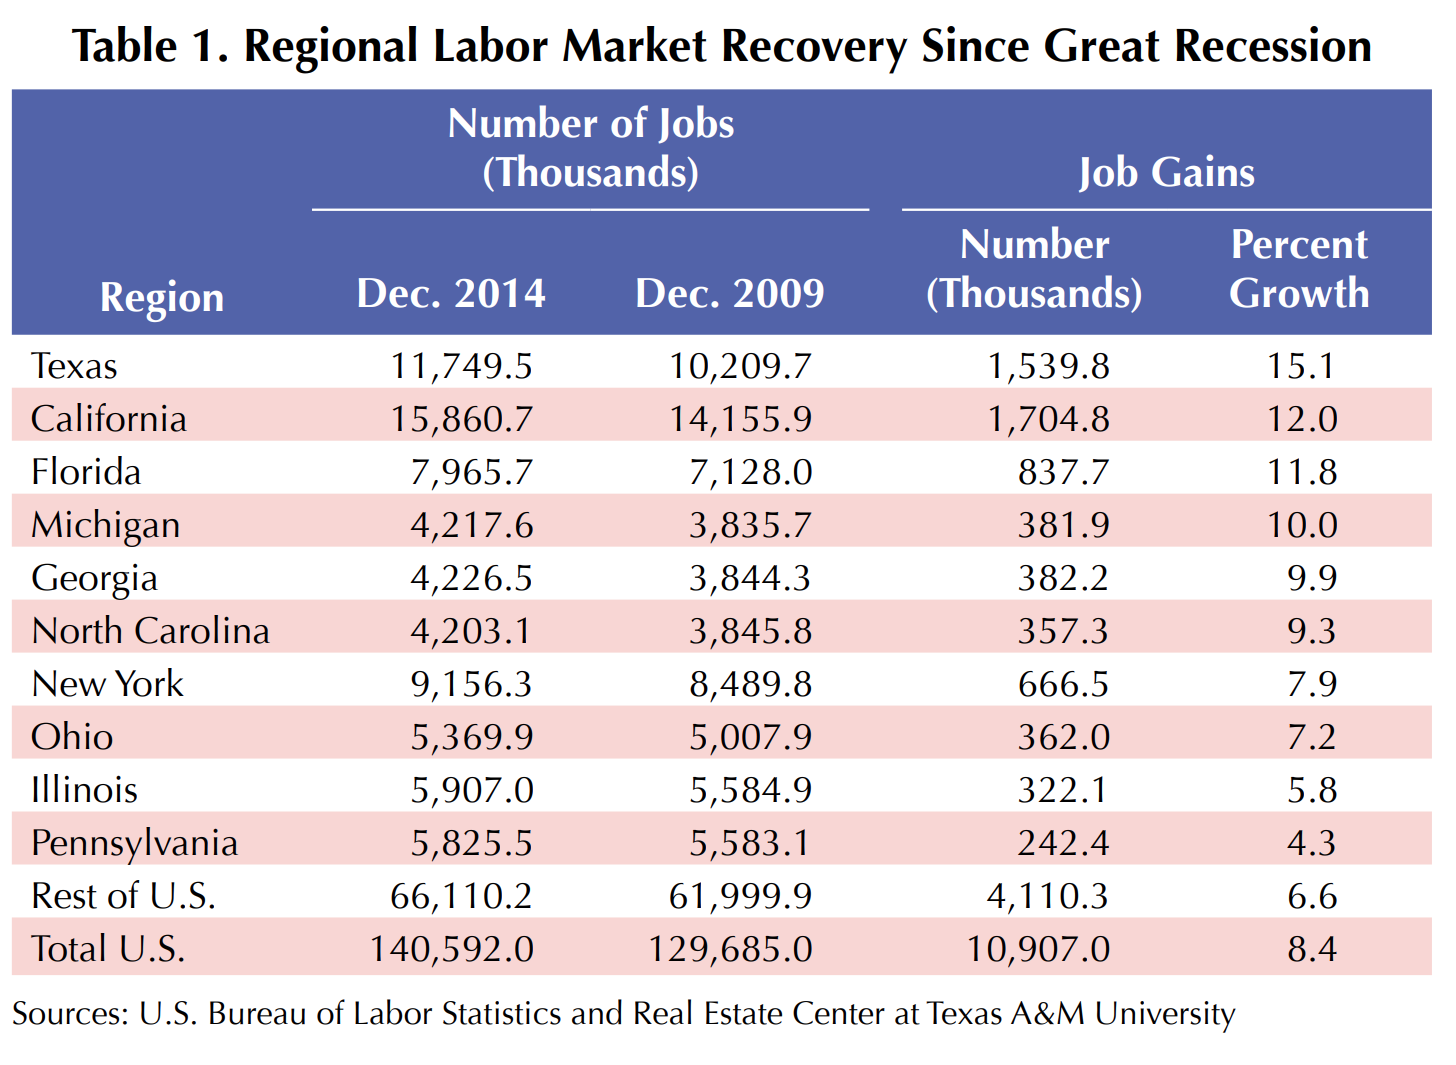
Table 1. Regional Labor Market Recovery Since Great Recession. This table shows data from the following regions: Texas, California, Florida, Michigan, Georgia, North Carolina, New York, Ohio, Illinois, Pennsylvania, Rest of U.S., and the Total U.S. The table presents the number of jobs (in thousands) in December 2014 and in December 2009 as well as the job gains, both in number (in thousands) and in percent growth. In Texas, there were 11,749.5 thousand jobs in December of 2014, in December to 2009 there were 10,209.7 thousand jobs. That is a 1,539.8 thousand increase in job gains and a 15.1% growth for Texas. In California, they had 15,860.7 thousand jobs in December 2014, and 14,155.9 thousand jobs in December 2009. They experienced a 1,704.8 thousand job increase, which is a 12% growth. In Florida December 2014, they had 7,965.7 thousand jobs, and in December 2009 they had 7,128 thousand jobs. They gained 837.7 thousand jobs, which is a 11.8% growth. In Michigan, they had 4,217.6 thousand jobs in December 2014 and 3,835.7 thousand jobs in December 2009. They experienced a 381.9 thousand job increase and a 10% growth. Georgia had 4,226.5 thousand jobs in December 2014, 3,844.3 thousand jobs in December 2009, a 382.2 thousand increase and a 9.9% growth in job gains. North Carolina had 4,203.1 thousand jobs in December 2014, 3,845.8 thousand jobs in December 2009, 357.3 thousand job increase and 9.3% growth. New York had 9,156.3 thousand jobs in December 2014, 8,489.8 thousand jobs in December 2009, a 666.5 thousand increase in jobs and 7.9% growth in job gains. Ohio had 5,369.9 thousand jobs in December 2014, 5,007.9 thousand jobs in December 2009, which was a 362 thousand increase in jobs and 7.2% growth in job gains. Illinois had 5,907 thousand jobs in December 2014, 5,583.1 thousand jobs in December 2009, which was a 322.1 thousand increase in jobs and 5.8% growth in job gains. Pennsylvania had 5,825.5 thousand jobs in December 2014 and 5,583.1 thousand jobs in 2009, which was a 242.4 thousand increase in jobs and 4.3% growth in job gains. The rest of the U.S. had 66,110.2 thousand jobs in December 2014 and 61,999.9 thousand jobs in December 2009, which is a 4,110.3 thousand increase in job gains and 6.6% growth. Overall, the U.S. had 140,592 thousand jobs in December 2014 and 129,685 thousand jobs in December 2009, which is a 10,907 thousand job gain and 8.4% growth in jobs. Data is sourced from the U.S. Bureau of Labor Statistics and Real Estate Center at Texas A&M University.

Texasโ€™ share of U.S. jobs increased from 7.9 percent in December 2009 to 8.4 percent in December 2014 (Figure 3). As a result of a higher-than-national average employment growth rate, Texasโ€™ share of U.S. jobs increased at the expense of New Yorkโ€™s and Californiaโ€™s share of jobs (Figure 3). Texasโ€™ share of U.S. jobs exceeded that of New York in 1994. The gap between Texas and California is narrowing.

Figure 3. Shares of U.S. Jobs Texas, California, New York is a line graph with a green line representing California, a pink link for Texas, and a blue line for New York. The graph shows the percent of shares of U.S. jobs for each of the three states. California remained above 10.5% from 1990 to 2014 while Texas and New York mostly stayed below 8%, with Texas gradually going up to around 8.4% in 2014. Source is the U.S. Bureau of Labor Statistics and Real Estate Center at Texas A&M University.

Sources of Texas Job Recovery
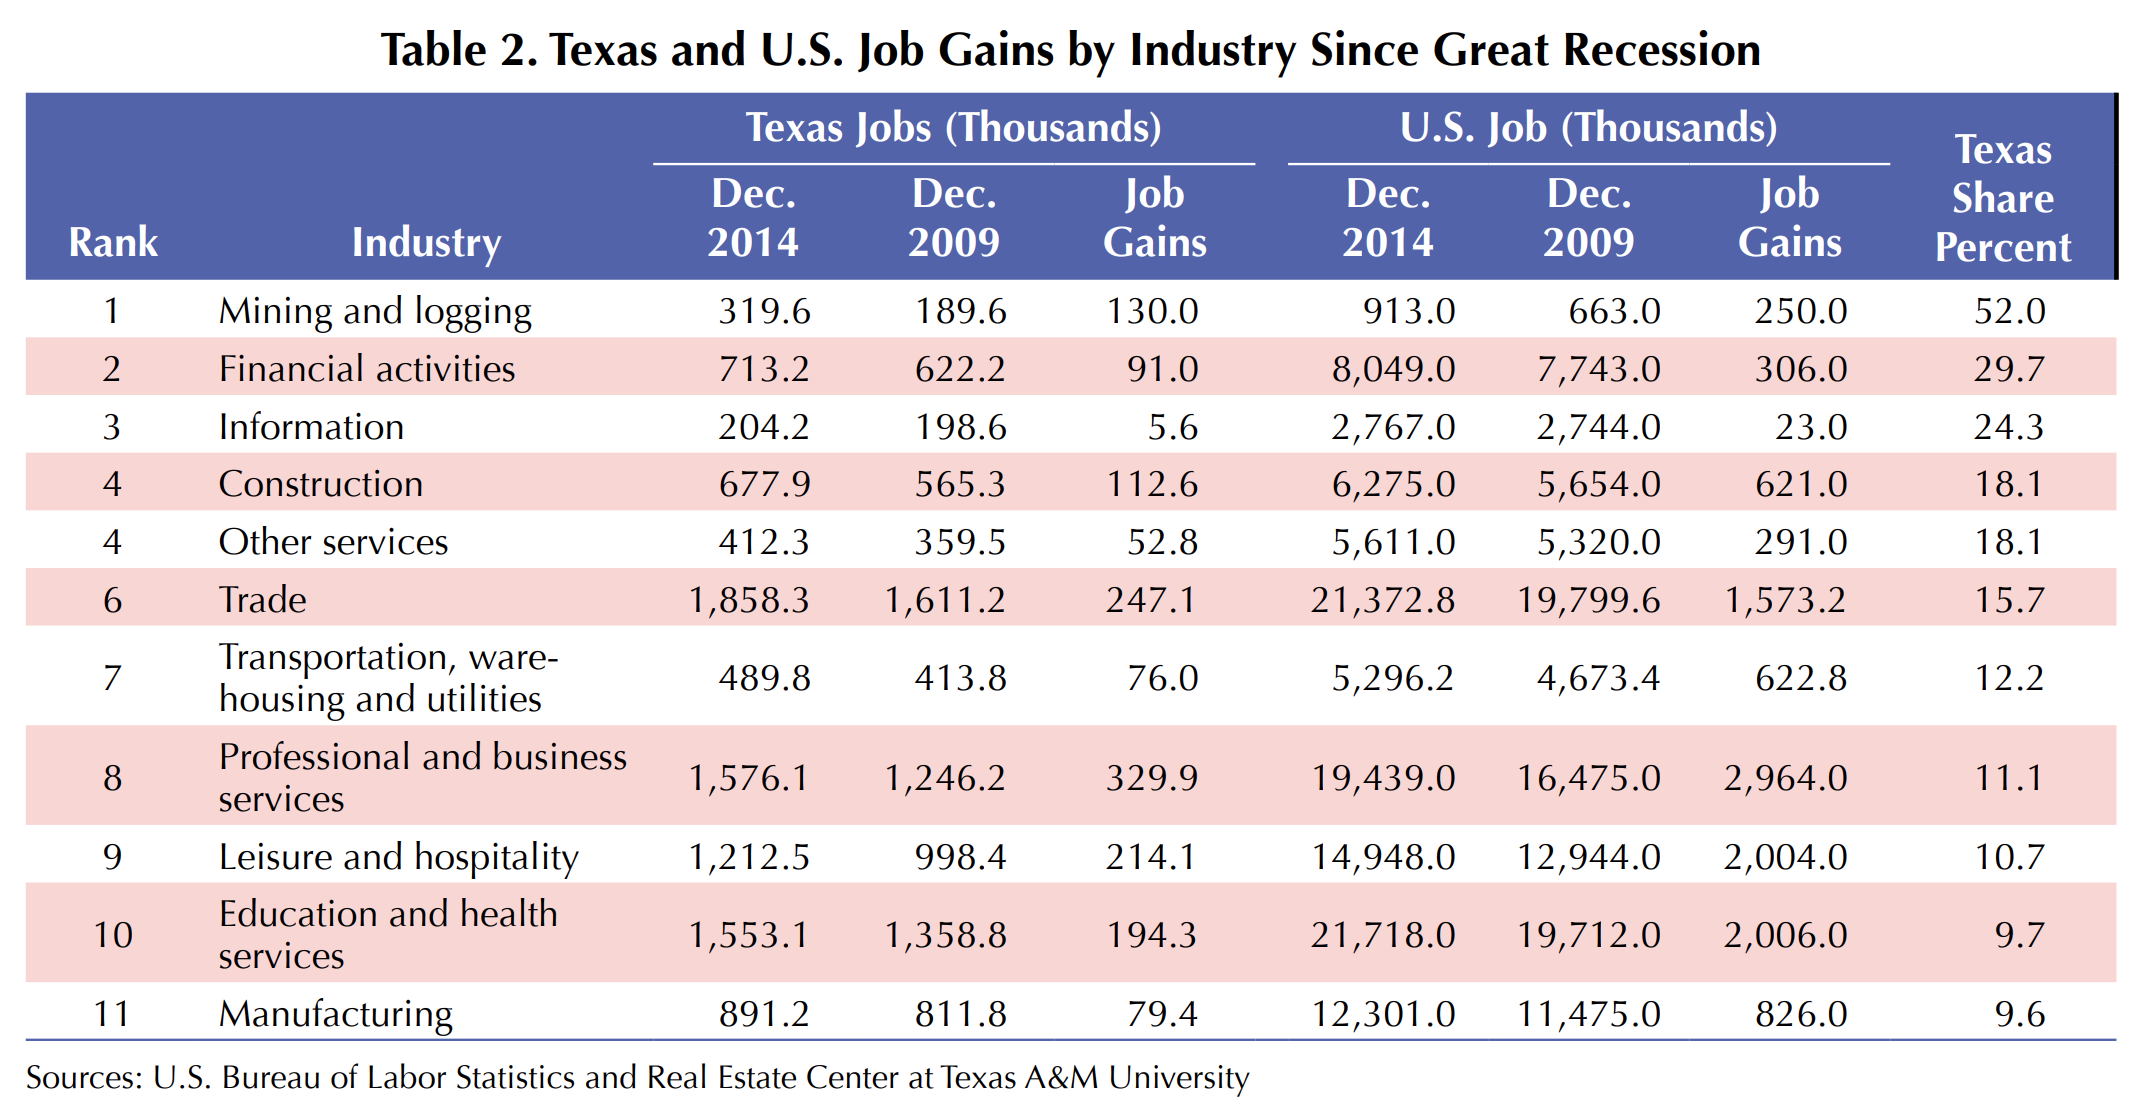
Texasโ€™ total job gains since the GR is the sum of net job gains by its industries. Table 2 shows Texas industries ranked by their shares of U.S. job gains since the end of GR. The stateโ€™s mining and logging industry created 52 percent of mining jobs and ranked first in job creation followed by financial activities, information and construction. In terms of the number of jobs, the stateโ€™s professional and business services industry, by creating 329,900 jobs, ranked first followed by the trade industry, leisure and hospitality, and education and health services (Table 2).
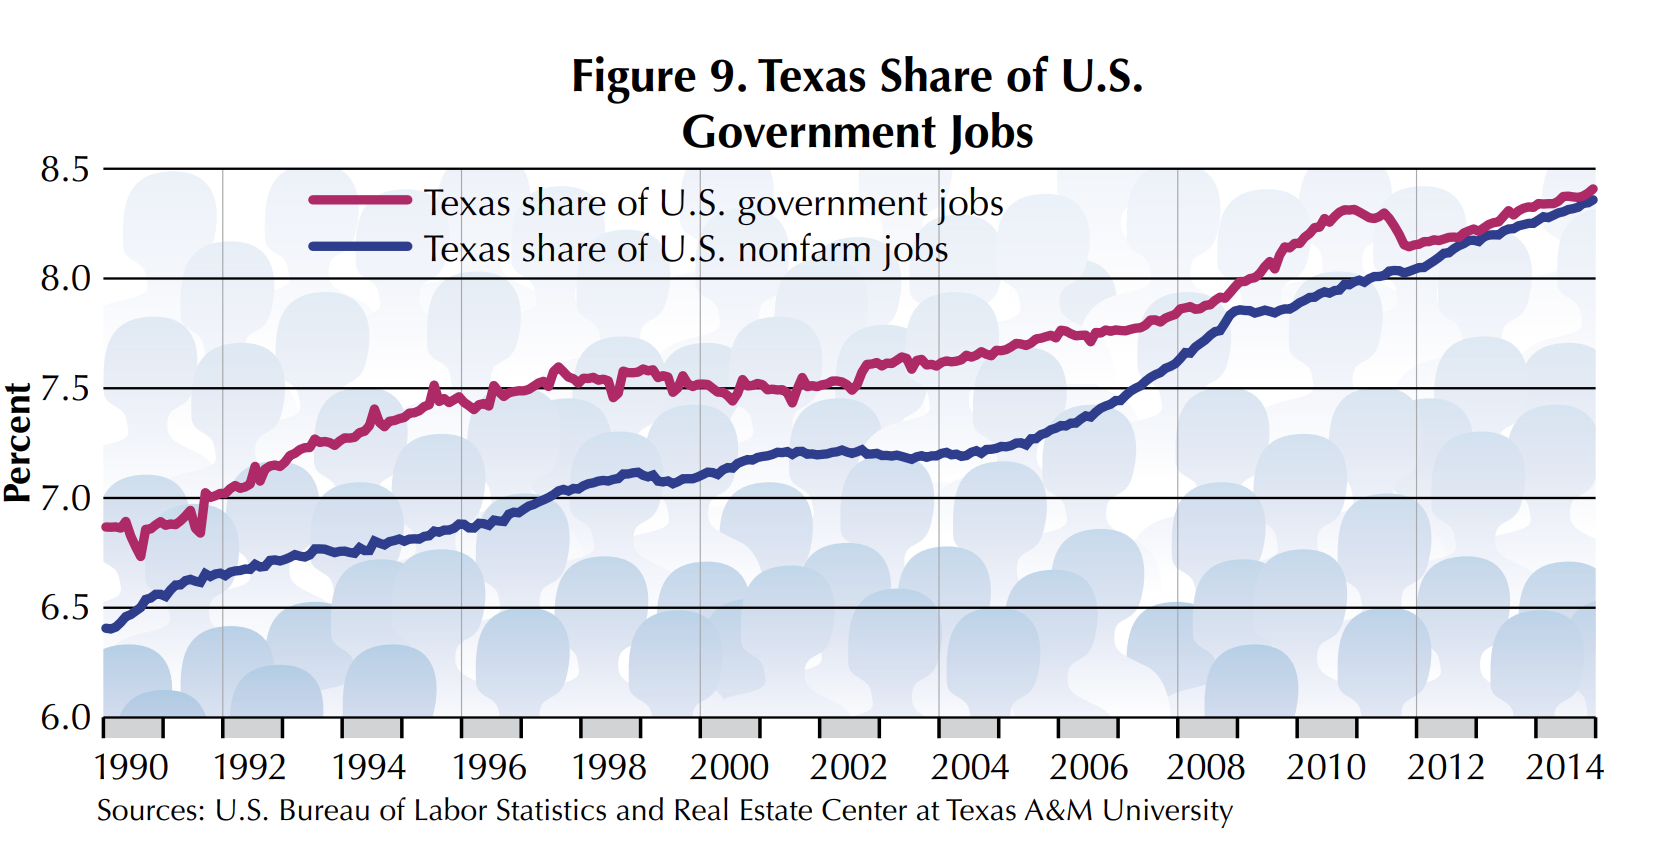
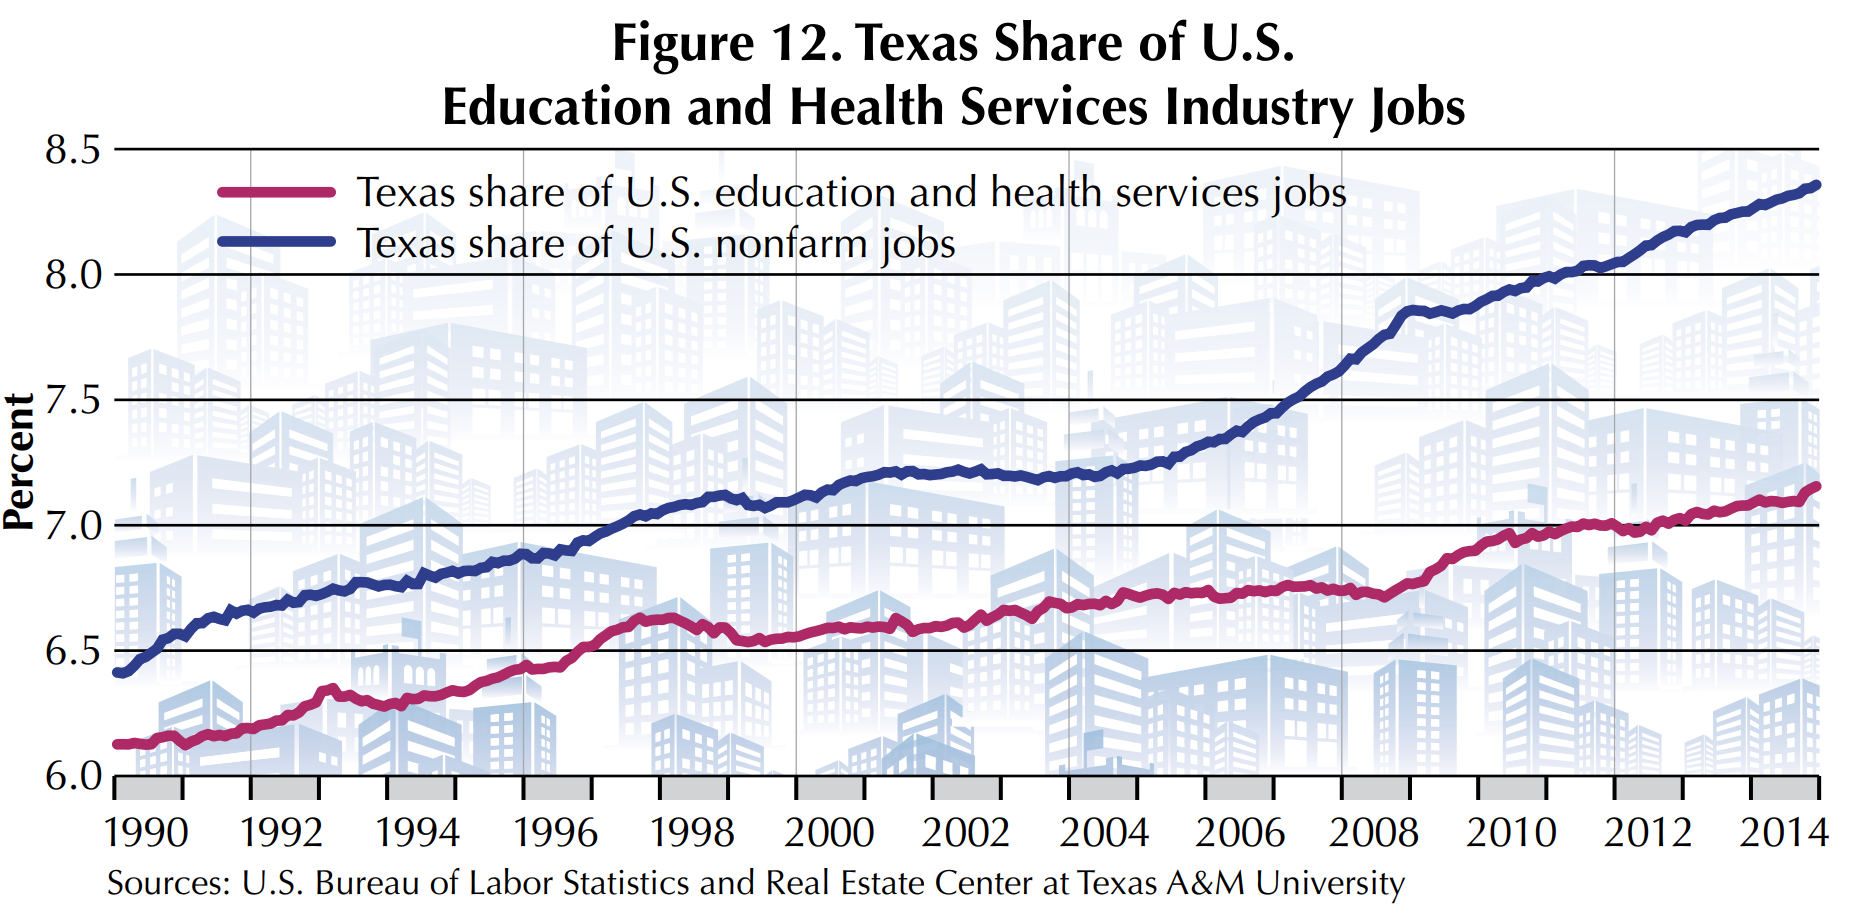
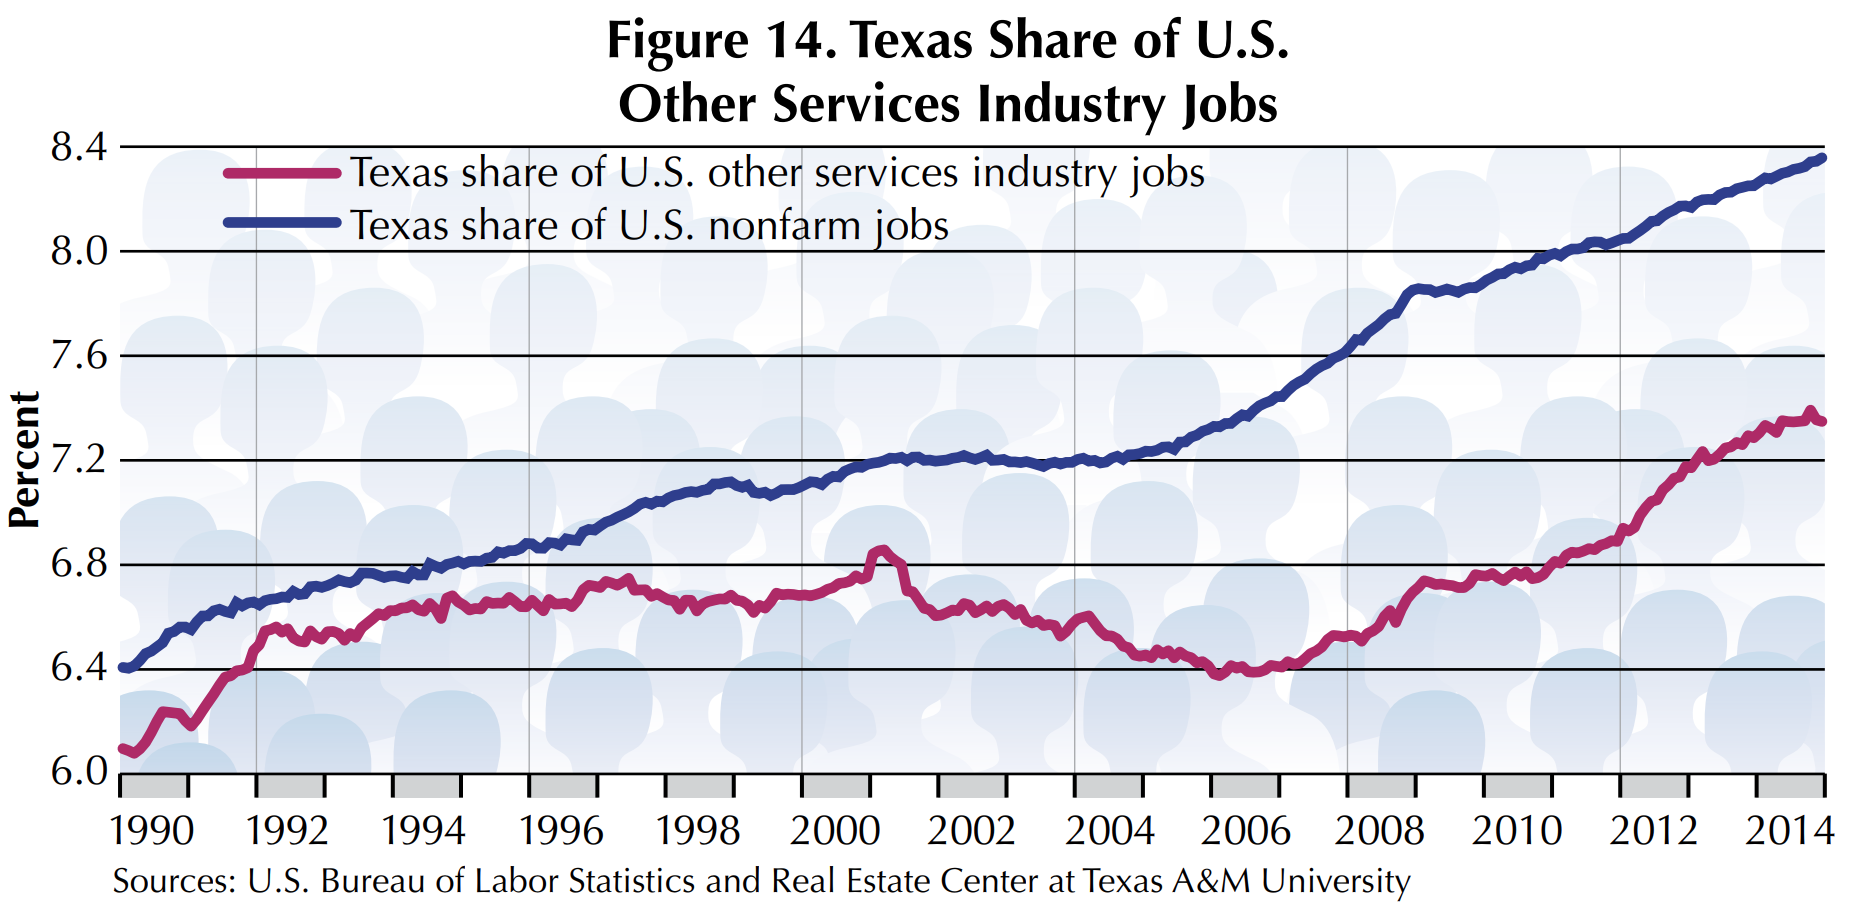
Table 2. Texas and U.S. Job Gains by Industry Since Great Recession. This table ranks the following industries from 1 to 11: Mining and logging, financial activities, information, construction, other services, trade, transportation, warehousing and utilities, professional and business services, leisure and hospitality, education and health services, and lastly, manufacturing. The table lists the number (in thousands) of Texas jobs each industry had in December 2014 and December 2009 and the number (in thousands) of job gains. The table also lists the U.S. jobs (in thousands) for each industry in December 2014 and in December 2009 as well as the amount of job gains. Lastly, the table provides the Texas share percent for each industry. Source is the U.S. Bureau of Labor Statistics and Real Estate Center at Texas A&M University.

Texasโ€™ stronger job market recovery has enhanced the long-term upward trends in the stateโ€™s share of U.S. jobs by industry. All Texas industries expanded their shares of U.S. jobs since the end of the GR, but the expansion rates varied across industries. Texasโ€™ share of jobs in the stateโ€™s mining and logging industry, construction, financial activities, trade, transportation, warehousing and utilities, and the government sector have been greater than the stateโ€™s share of U.S. nonfarm jobs (Figures 4 to 9). The stateโ€™s shares of manufacturing, professional and business services, education and health services, leisure and hospitality, and other services industries have been less than the stateโ€™s shares of nonfarm jobs (Figures 10 through 14).
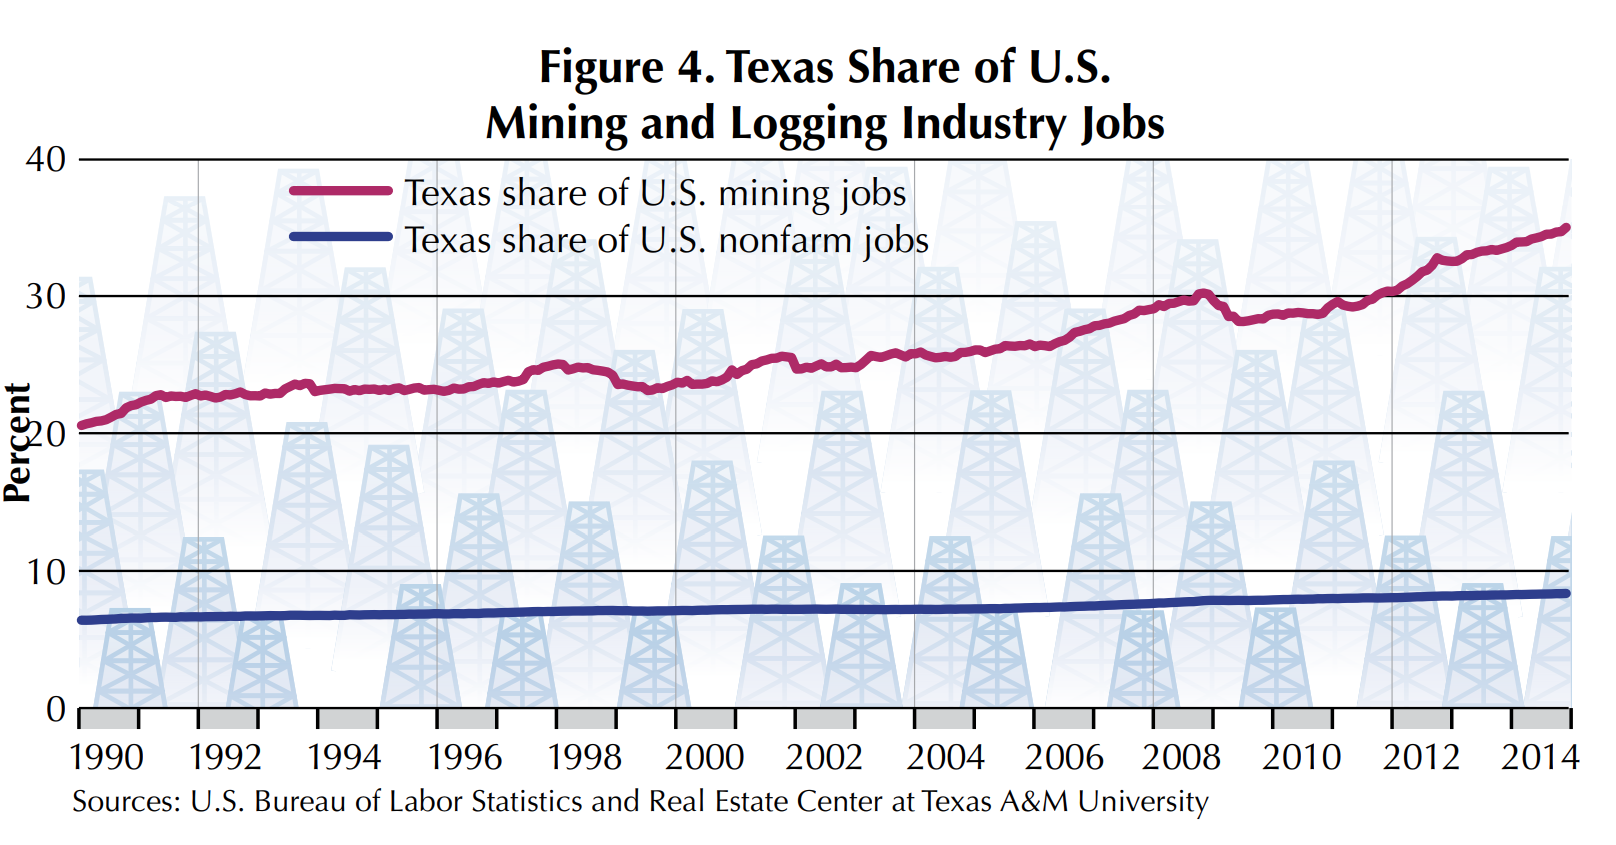
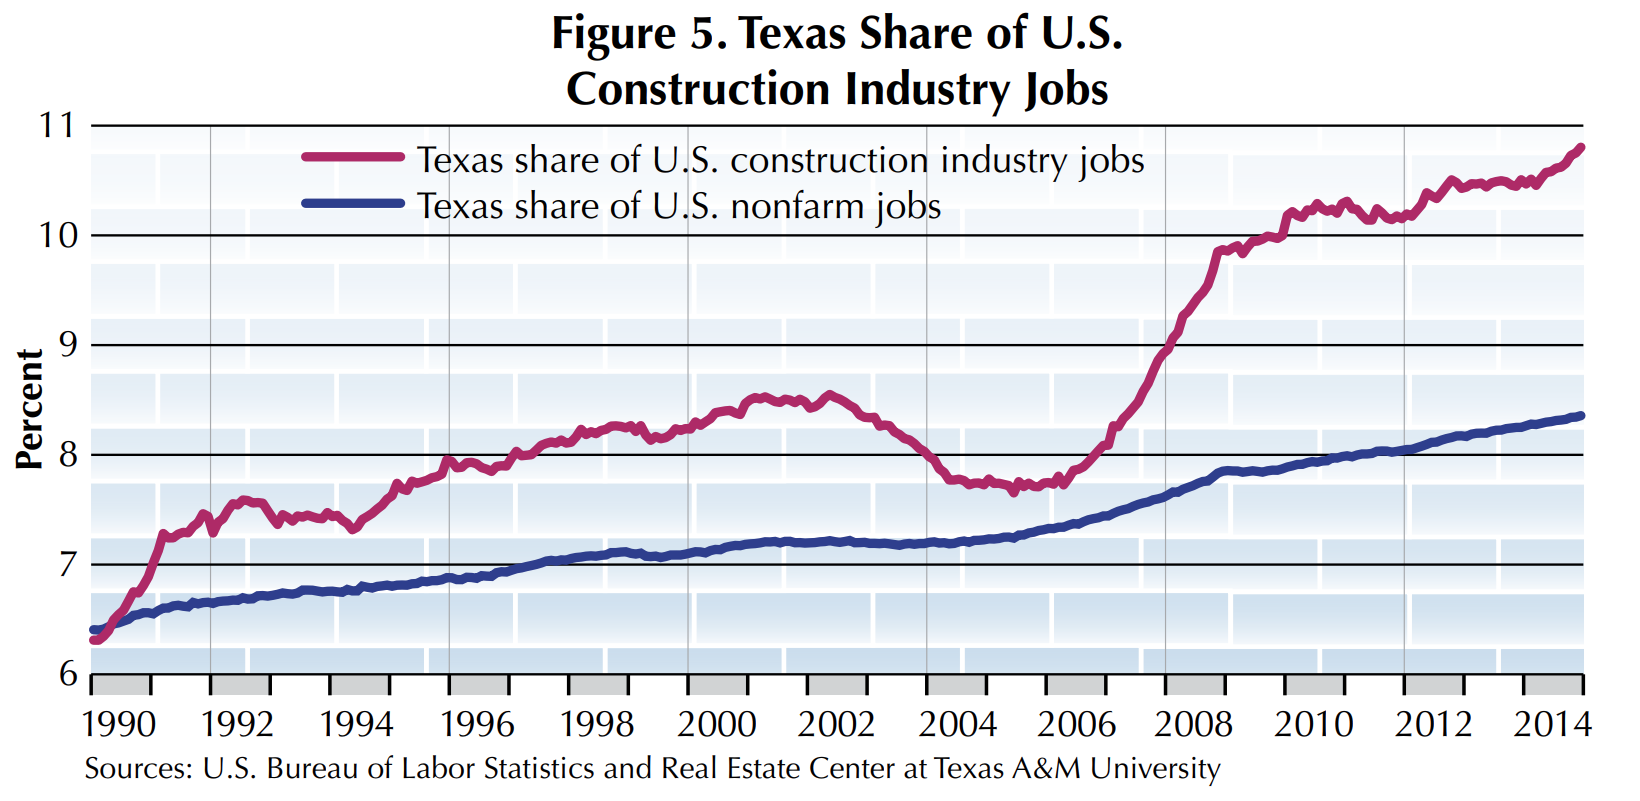
Figure 4. Texas Share of U.S. Mining and Logging Industry Jobs. This line graph has a pink line for Texas share of U.S. mining jobs and a blue line for Texas share of U.S. nonfarm jobs.   In the graph, from 1990 to 2014, Texas had a relatively stable share of U.S. nonfarm jobs, staying around 9%. Texas share of U.S. mining jobs stayed above 20% since 1990 and gradually increased to its peak of around 35% in 2014. Source is the U.S. Bureau of Labor Statistics and Real Estate Center at Texas A&M University.
Figure 5. Texas Share of U.S. Construction Industry Jobs is a line graph with a pink line for Texas share of U.S. construction industry jobs and a blue line for Texas share of U.S. nonfarm jobs. Source is the U.S. Bureau of Labor Statistics and Real Estate Center at Texas A&M University.
Figure 5. Texas Share of U.S. Financial Activities Industry Jobs is a line graph with a pink line for Texas share of U.S. financial activities jobs and a blue line for Texas share of U.S. nonfarm jobs. Source is the U.S. Bureau of Labor Statistics and Real Estate Center at Texas A&M University.
Figure 5. Texas Share of U.S. Trade Industry Jobs is a line graph with a pink line for Texas share of U.S. trade jobs and a blue line for Texas share of U.S. nonfarm jobs. Source is the U.S. Bureau of Labor Statistics and Real Estate Center at Texas A&M University.

Helped by higher oil prices, Texasโ€™ mining and logging industry experienced the largest increase in share of U.S. mining jobs, from 28.6 percent in December 2009 to 35 percent in December 2014, well above the stateโ€™s share of U.S. nonfarm jobs (Figure 4). Texasโ€™ share of U.S. construction jobs expanded rapidly in the GR, but the expansion rate has slowed since 2010 (Figure 5). Texasโ€™ share of financial activities jobs has exceeded the stateโ€™s shares of nonfarm jobs since 1999 and reached 8.9 percent in December 2014 (Figure 6). Texasโ€™ share of U.S. trade industry jobs has moved alongside and above the stateโ€™s shares of U.S. nonfarm jobs, reaching 8.7 percent in December 2014 (Figure 7). The stateโ€™s transportation and utilities industry posted a steady long-run upward trend and expanded its share of U.S. jobs from 7.1 percent in December 1990 to 9.2 percent in December 2014 (Figure 8).

Figure 5. Texas Share of U.S. Transportation and Utilities Industry Jobs is a line graph with a pink line for Texas share of U.S. transportation, utilities, and warehousing jobs and a blue line for Texas share of U.S. nonfarm jobs. Source is the U.S. Bureau of Labor Statistics and Real Estate Center at Texas A&M University.

Texasโ€™ shares of government jobs after the GR were higher than the stateโ€™s shares of U.S. nonfarm jobs until 2012. Since then, the gap between the stateโ€™s share of U.S. nonfarm jobs and its share of U.S. government jobs has been narrowing (Figure 9). Texasโ€™ share of U.S. manufacturing jobs has moved alongside and below its share of U.S. nonfarm jobs, reaching 7.2 percent in December 2014 (Figure 10).

Figure 5. Texas Share of U.S. Government Jobs is a line graph with a pink line for Texas share of U.S. government jobs and a blue line for Texas share of U.S. nonfarm jobs. Source is the U.S. Bureau of Labor Statistics and Real Estate Center at Texas A&M University.
Figure 5. Texas Share of U.S. Manufacturing Industry Jobs is a line graph with a pink line for Texas share of U.S. manufacturing jobs and a blue line for Texas share of U.S. nonfarm jobs. Source is the U.S. Bureau of Labor Statistics and Real Estate Center at Texas A&M University.

The long-run upward trend in Texasโ€™ share of U.S. professional and business services jobs accelerated from 6.8 percent in December 2004 to 8.1 percent at the end of 2014 (Figure 11). Another long-term upward trend expanded Texasโ€™ share of U.S. education and health services industry jobs to 7.2 percent in December 2014 (Figure 12).
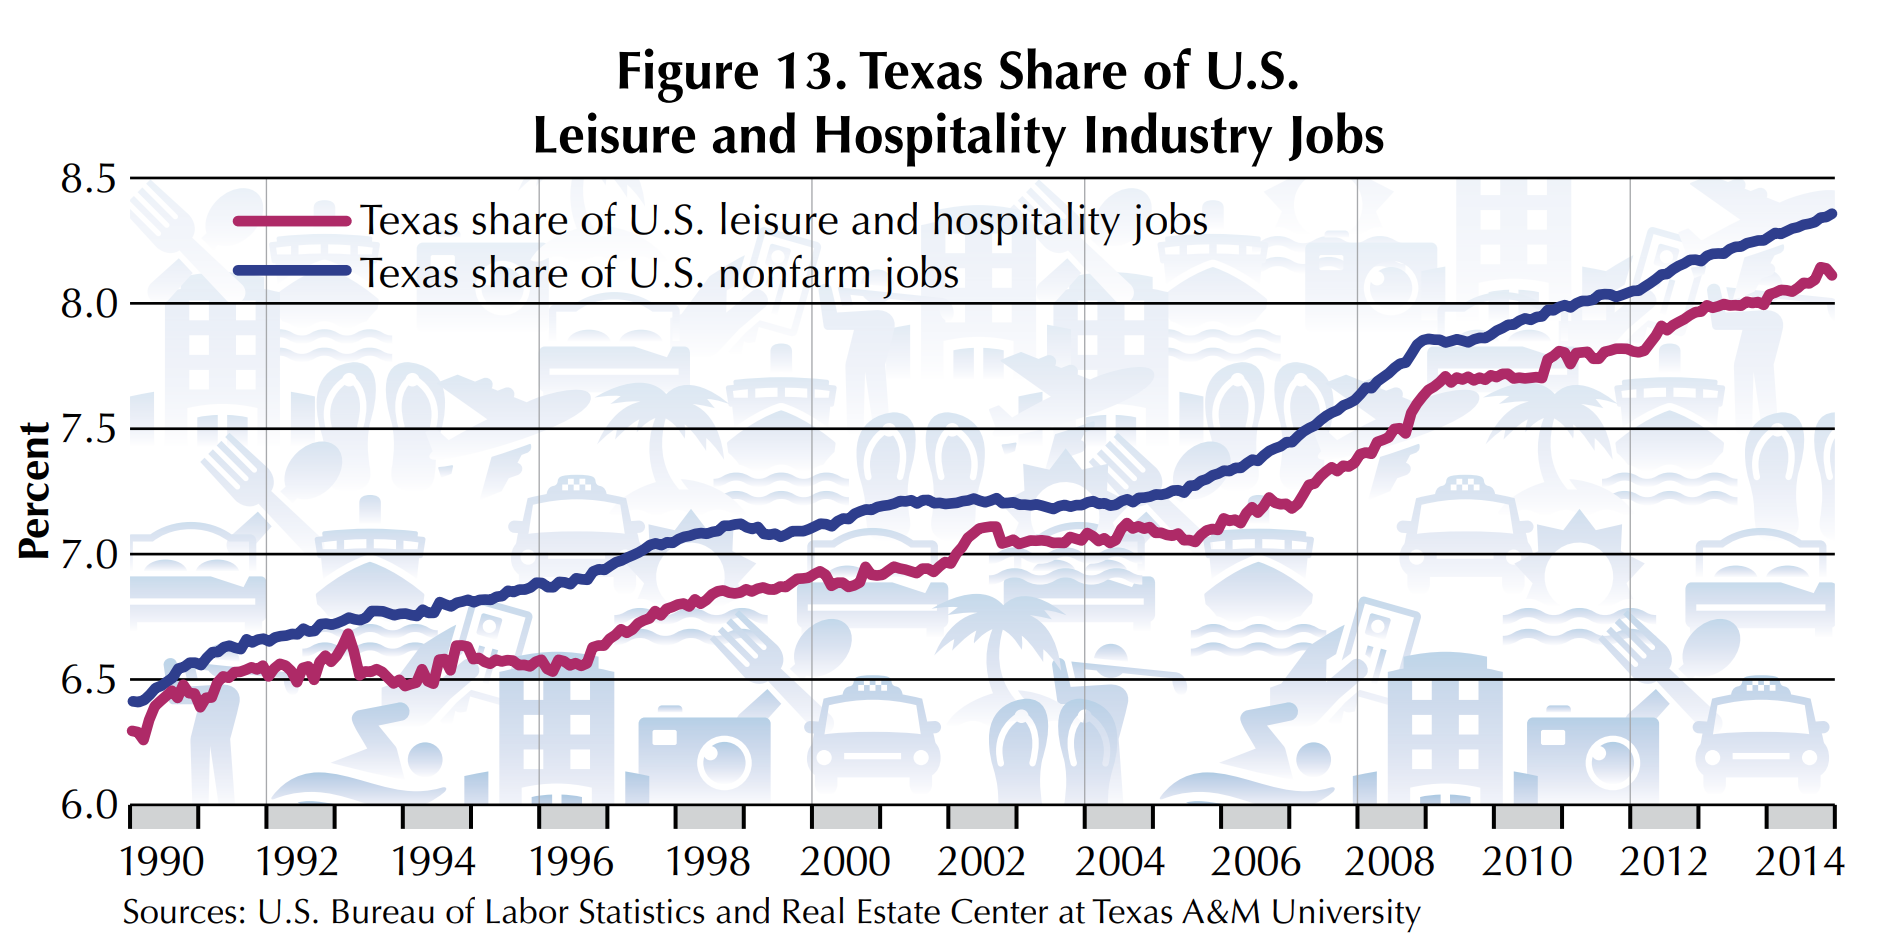
Figure 5. Texas Share of U.S. Professional and Business Services Industry Jobs is a line graph with a pink line for Texas share of U.S. professional and business services jobs and a blue line for Texas share of U.S. nonfarm jobs. Source is the U.S. Bureau of Labor Statistics and Real Estate Center at Texas A&M University.
Figure 5. Texas Share of U.S. Education and Health Services Industry Jobs is a line graph with a pink line for Texas share of U.S. education and health services jobs and a blue line for Texas share of U.S. nonfarm jobs. Source is the U.S. Bureau of Labor Statistics and Real Estate Center at Texas A&M University.
Figure 5. Texas Share of U.S. Leisure and Hospitality Industry Jobs is a line graph with a pink line for Texas share of U.S. leisure and hospitality jobs and a blue line for Texas share of U.S. nonfarm jobs. Source is the U.S. Bureau of Labor Statistics and Real Estate Center at Texas A&M University.

The stateโ€™s share of leisure and hospitality jobs was lower than its share of the U.S. nonfarm jobs at 8.1 percent in December 2014 (Figure 13). Texasโ€™ share of the U.S. other services industry has trended upward since 2006, reaching 7.3 percent in December 2014 (Figure 14). The stateโ€™s information industry, which suffered job losses in the aftermath of the bursting of the dot.com bubble in the early 2000s, expanded its share of U.S. jobs to 7.4 percent at the end of 2014 (Figure 15).

Figure 5. Texas Share of U.S. Other Services Industry Jobs is a line graph with a pink line for Texas share of U.S. other services industry jobs and a blue line for Texas share of U.S. nonfarm jobs. Source is the U.S. Bureau of Labor Statistics and Real Estate Center at Texas A&M University.
Figure 5. Texas Share of U.S. Information Industry Jobs is a line graph with a pink line for Texas share of U.S. information industry jobs and a blue line for Texas share of U.S. nonfarm jobs. Source is the U.S. Bureau of Labor Statistics and Real Estate Center at Texas A&M University.

Job Recovery by Metropolitan Areas

Table 3. Texas Metro Areas Ranked by Shares of Texas job Gains. Here are the following Metropolitan Areas ranked from 1 to 26 in order: Houston-Sugar Land-Baytown, Dallas-Plano-Irving, Austin-Round Rock, Fort Worth-Arlington, San Antonio-New Braunfels, Midland, McAllen-Edinburg-Mission, Odessa, Corpus Christi, El Paso, Laredo, Longview, Brownsville-Harlingen, Lubbock, Killeen-Temple, College Station-Bryan, Beaumont-Port Arthur, Tyler, Victoria, Amarillo, San Angelo, Waco, Sherman-Denison, Abilene, Wichita Falls, and Texarkana. The table also lists micropolitan Texas and the total of all areas. The table presents the number of jobs (thousands) for each region in December 2014 and December 2009 and the number (thousands) and percent of job gains for each area. Data is sourced from U.S. Bureau of Labor Statistics and Real Estate Center at Texas A&M University.

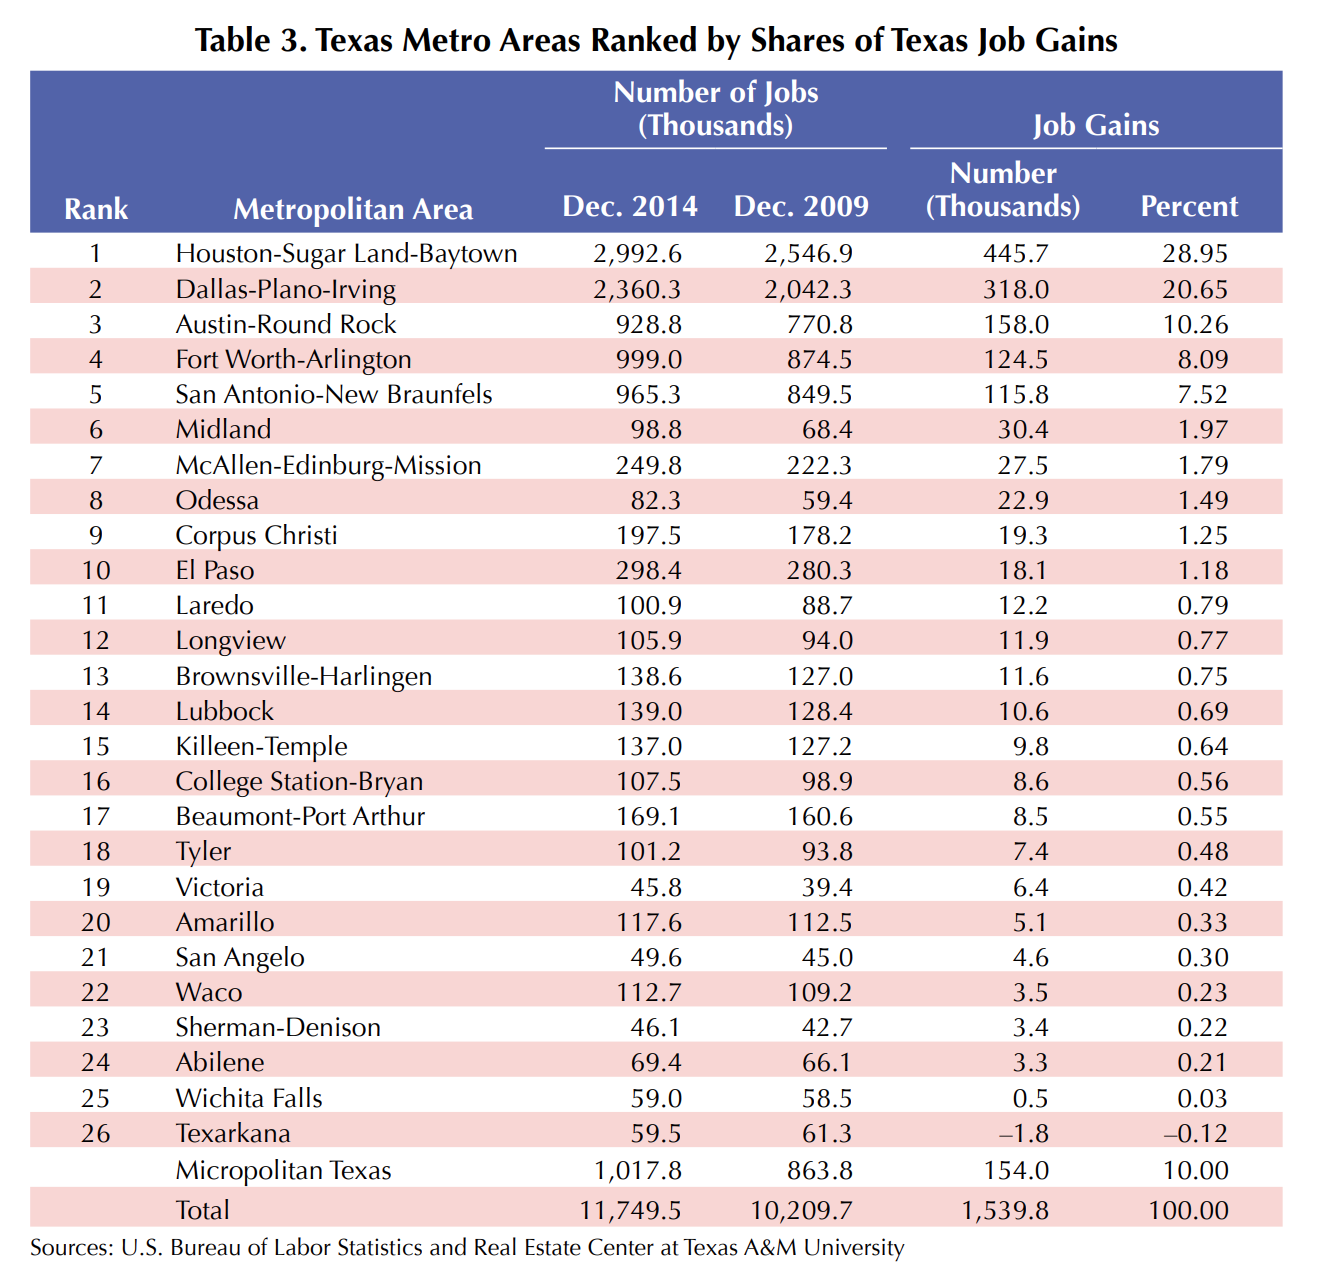
Texas job gains are the sum of job gains of the stateโ€™s local economies (Table 3). Houston-Sugar Land-Baytown ranked first in the stateโ€™s labor market recovery, accounting for 28.95 percent of the stateโ€™s job gains from 2009 to 2014, followed by Dallas-Plano-Irving (20.65 percent), Austin-Round Rock (10.26 percent), Fort Worth-Arlington (8.09 percent), and San Antonio-New Braunfels (7.52 percent). Although larger metropolitan areas generated more jobs, higher oil prices boosted job gains in Midland and Odessa.

Texas Job Gains and the State’s Real Estate Industry

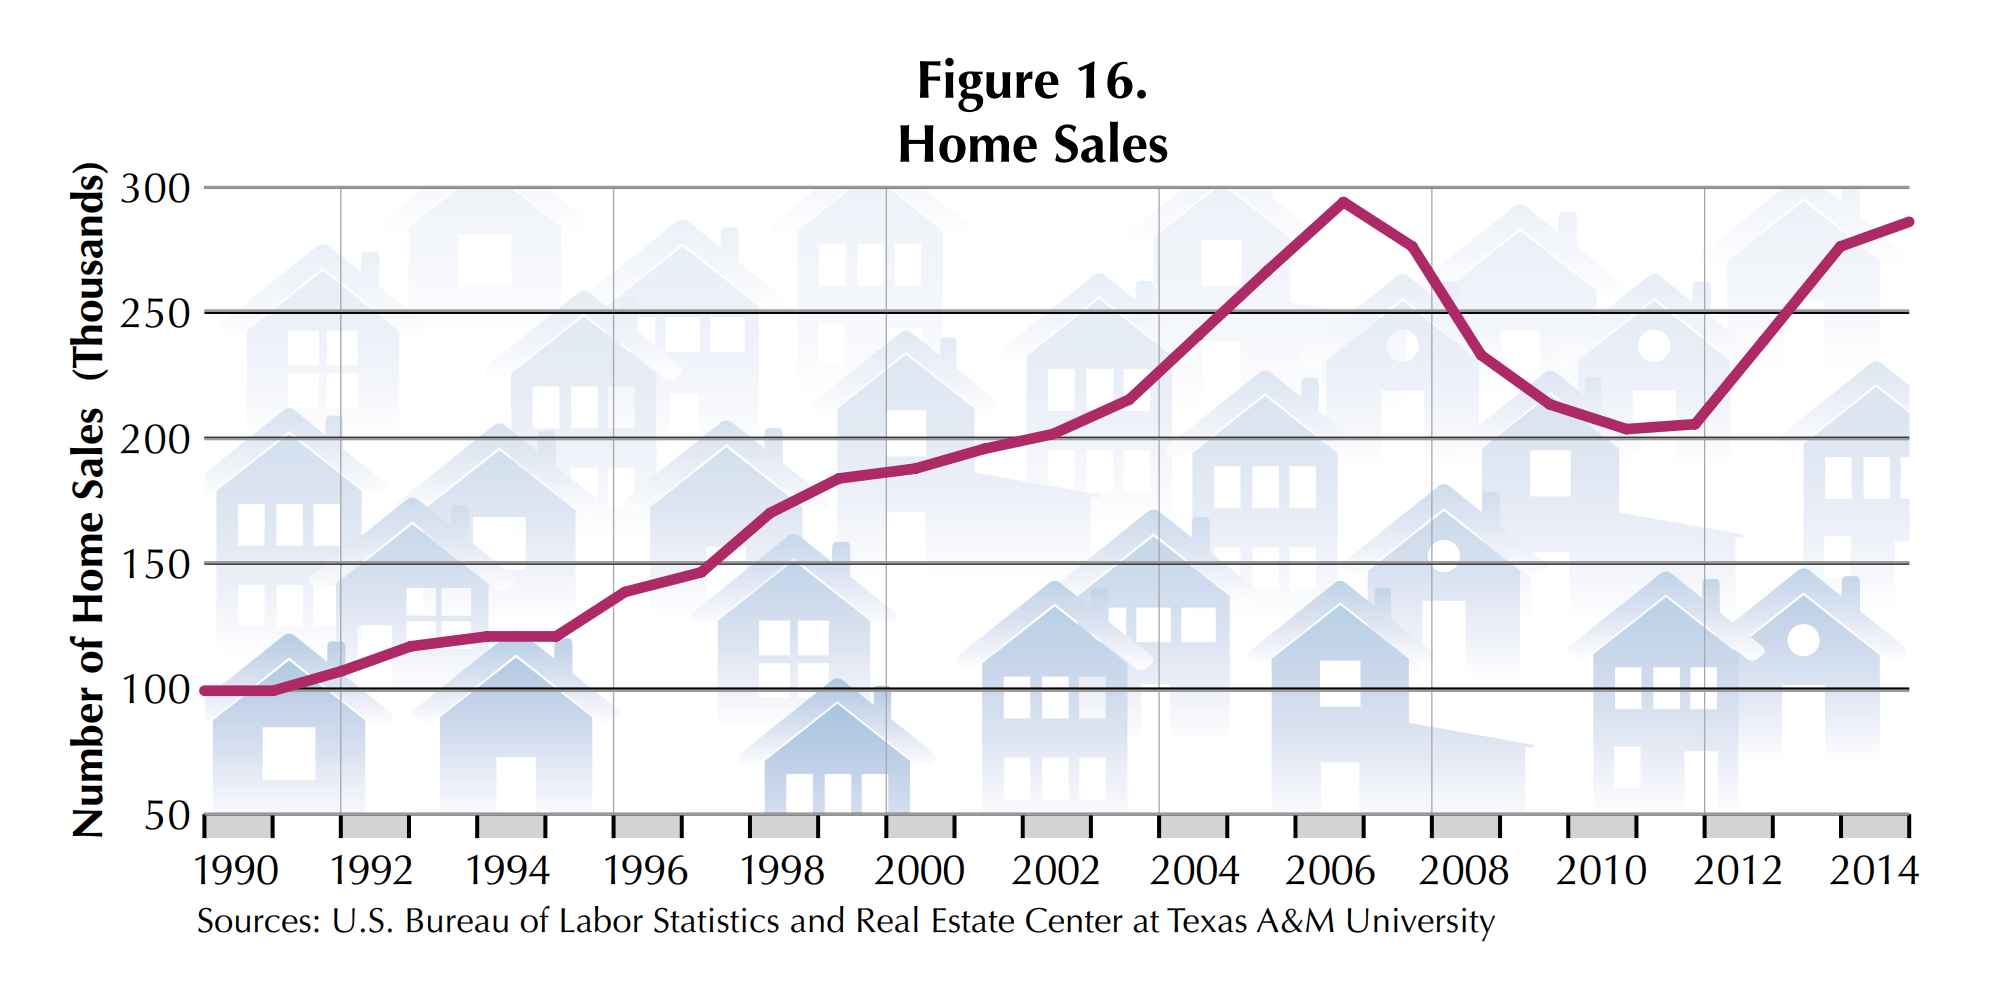
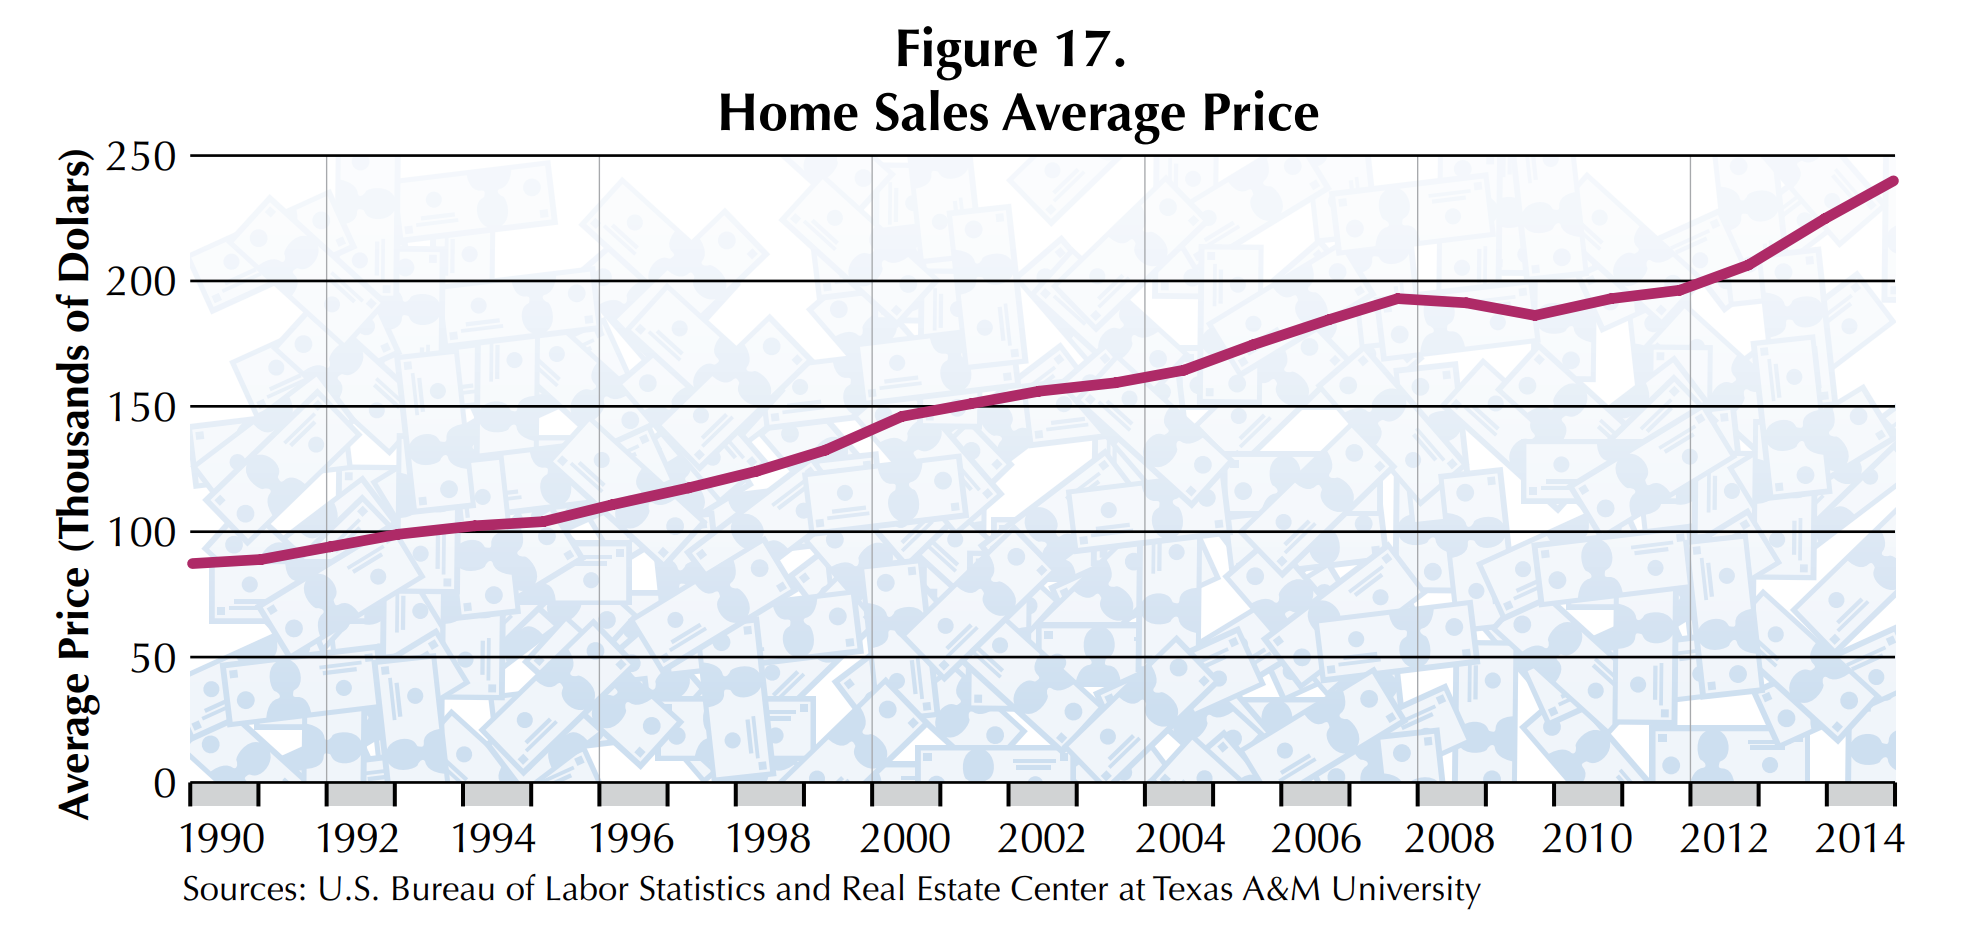
Texas post-GR job gains have helped both Texas home sales and home prices to rebound from the GR. The number of homes sold increased from 203,637 units in 2010 to 285,111 in 2014, a 40 percent increase (Figure 16). The average Texas home price increased by 24.7 percent, from $192,300 in 2010 to $239,800 in 2014 (Figure 17).

Figure 16. Home Sales is a line graph representing the changes in numbers of homes sales (in thousands) from 1990 to 2014. Source is the U.S. Bureau of Labor Statistics and Real Estate Center at Texas A&M University.
Figure 17. Home Sales Average Price is a line graph that represents the changes in average price (in thousands of dollars) from 1990 to 2014. Source is the U.S. Bureau of Labor Statistics and Real Estate Center at Texas A&M University.

Texasโ€™ labor market recovery has been stronger than the nationโ€™s, attracting more people and companies to Texas and increasing demand for all types of real estate properties. As Texasโ€™ shares of U.S. jobs by industry demonstrate, the stateโ€™s job gains are broad based, leading particularly to more demand for commercial and industrial real estate properties in Texas.

As to the future, the Texas economy is expected to continue generating more jobs but at a slower pace because of falling oil prices. Since June 2014, the stateโ€™s oil and gas extraction industry has curtailed its investment expenditures. As in the past, the stateโ€™s economy is expected to weather the current oil price collapse in the longer term, but 2015โ€“16 will be a challenging period and a test of its strength.


Dr. Anari ([email protected]) is a research economist with the Real Estate Center at Texas A&M University.

Download PDF

In This Article

You might also like

Not Back Yet
7 minute read
Jul 01 2016

Not Back Yet

Some States Still Lagging After Great Recession
It should come as no surprise that the Texas economy has outperformed most states and the United States as a whole over the last decade. However, it may be surprising...
Read Article
Checking Out
4 minute read
Dec 01 2020

Checking Out

Leisure and Hospitality Industry's Struggle

COVID-19 was a nightmare guest for the state’s leisure and hospitality industry in 2020, virtually shutting down hotels, restaurants, and entertainment venues and putting hundreds of thousands out of work. The sector is still recovering from the labor pains.

Read Article
Industrial Space Race
Industrial
6 minute read
Mar 15 2023

Industrial Space Race

Texas Market Overview

Fasten your seats belts. Demand for Industrial real estate has taken off in recent years, with the latest metrics showing an especially healthy market in Texas’ largest metros.

Read Article
Tierra Grande
PUBLISHED SINCE 1977

Tierra Grande

Check out the latest issue of our flagship publication.

SUBSCRIBE TO OUR

Publications

Receive our economic and housing reports and newsletters for free.