Texas Land Market Developments — 2006
Texas land markets roared into uncharted territory in 2006 with buyers’ insatiable demand for properties driving the statewide price per acre 23 percent higher that they were in 2005. Here is a region-by-region report.

Summary of Texas Land Market Developments – 2006
- Prices rose 23 percent, from $1,483 per acre in 2005 to $1,825 per acre in 2006, falling just short of the record one-year 30 percent increase recorded in 1973.
- Size of properties continued to fall, averaging 98 acres in 2006.
- Prices rose strongly throughout the state.
- Investment interest in land continued.
- Out-of-state and foreign investors appeared in greater numbers.
- Some investors appear to perceive inflation in the future.
- Buyers are flocking to the market to buy before rising prices force them out of the market.
- The market continues to see a dearth of quality properties for sale.
- Buyers were more likely to borrow purchase money as lenders strongly competed for business. However, loan-to-value ratios were reportedly modest.
- Corn prices pushed by anticipated demand for ethanol prompted more farmers to seek out land.
- Although observers express some concern about the rate of increase in prices, developments in 2007 should produce another sizable gain in land prices by year’s end.
Texas land markets roared into uncharted territory in 2006 with buyers’ insatiable demand for properties driving the statewide price per acre 23 percent above 2005 market levels. The price of an acre of Texas rural land soared from $1,483 per acre in 2005 to $1,825 per acre in 2006 (Figure 1). The 2006 price represents a 14 percent annual compound growth rate since 2001. Prices increased more than 93 percent over that five-year period. This marks the fourth straight year that price growth exceeded 10 percent and amounts to an acceleration of land price growth over 2004–05 levels.
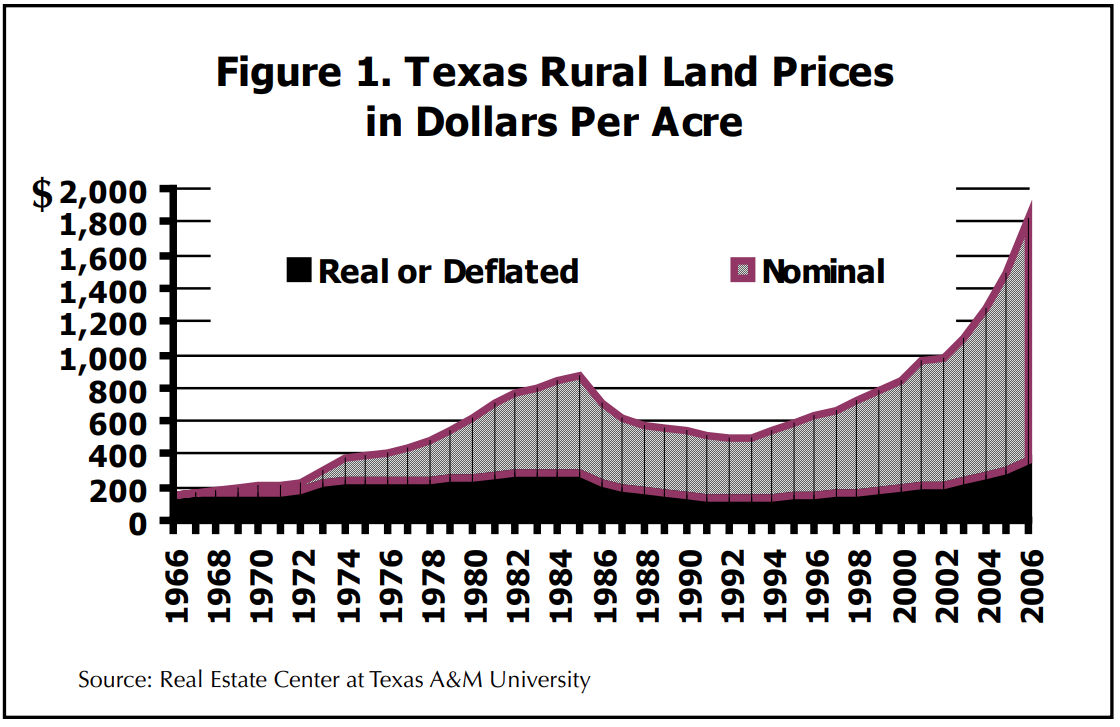
The real or inflation-adjusted price of $365 per acre in 1966 dollars pushed past the previous record high set in 2005 by $59 per acre. Nominal prices shown in Figure 1 reflect the actual prices paid while real prices represent those nominal prices adjusted for inflation. The real price change indicates that prices, in terms of purchasing power, rose 20 percent above inflation in 2006.
The volume of sales remained strong (Figure 2). Fueled by high demand, the 2006 markets recorded the volume of reported sales at 8,215, slightly below the 2005 record volume of 8,368 sales. The explosion in land buying activity that began in 2002 continues unabated.

Tract Size
At 98 acres, the typical transaction remained at the low end of the size spectrum. Figure 3 reveals that tract size has inched below 100 acres and remains substantially under the 140-acre levels posted through most of the 1990s.

The drop in size roughly coincided with the increase in volume as a growing number of buyers scoured the countryside for properties that fit their land purchase budgets. The rush to subdivide larger holdings has resulted in a shortage of very large properties.
Figure 4 shows the number of sales smaller than 100 acres along with the associated median price per acre for those small sales. Sales of small properties declined during the 1970s through the 1980s, setting historic lows in 1980 and 1987. The volume of small sales began a gradual increase after 1993, then sharply increased after 2000.

Historically averaging 42 percent of total sales, small tracts grew to more than 48 percent of total sales for the past four years. The proportion last dropped below that threshold in 2002 (Figure 5). Small properties have also posted dramatic increases in price per acre. These developments have coincided with buyers rushing to the countryside in all parts of Texas.

For investors with substantial amounts to invest, the array of available large properties is limited owing to the breakup of large holdings. The resulting dearth of large properties has forced buyers to pay a per acre premium for large properties. Figure 6 reveals an expansion in the number of 5,000-acreplus properties sold after 2000, until the figure dropped slightly in 2005 and again in 2006. Although the volume of 80 to 90 sales is a small portion of the market, that level is much higher than the 30 or so sales occurring annually in the 1980s and 1990s. In addition to the uptick in volume, the median price paid for large tracts continues to increase well above 1990s prices.

Large ranch sales make up a small proportion of the land market. The focus of this segment of the market has shifted since 2001. From 1966 to 2006, the market for large tracts was concentrated in West Texas, in Land Market Areas 1–9 (see appendix for geographic boundaries of LMAs). West Texas has historically accounted for more than 70 percent of large tract sales. However, in 2002, that fell to 65 percent and in 2005 declined to 50 percent of large sales.

In 2005, half of large sales occurred outside of West Texas, with the largest volume (12 sales or 15 percent of total sales) taking place in the Rio Grande Plains of South Texas (LMA 11). The North Central Plains (LMA 12) accounted for another nine sales or 11.25 percent of large transactions. Obviously, large tract buyers are now looking statewide.
Changes in Market Dynamics
More and more buyers are no longer content to choose from properties on the market. Instead, buyer’s representatives now frequently locate properties matching sellers’ specified search criteria and approach the landowners with repeated offers until they agree to sell.
The prevalance of these kinds of bidding transactions may account for the sizable increases in market trend indicators. Specifically, these bidding transactions normally focus on highly desirable properties. Therefore, they may be altering the composition of the market by moving a higher percentage of superior quality properties through the market than in the normal historical setting in which buyers choose from listed properties. Because current market price indicators may include a disproportionate number of superior properties, they may indicate trends that are at odds with land price levels in a more representative sample of properties.
As Texas has evolved into an urban-based society, nonfarm buyers have flocked to the countryside buying acreage for recreation and investment. In the past decade, these nonagricultural buyers have come to dominate market activity. Increasingly, sellers are taking advantage of 1031 exchange opportunities in the IRS regulations to avoid capital gain taxes on the sale of real estate.
The 1031 exchange allows an owner to convert one real estate investment in another without recognizing the gain as taxable income. Market participants are now noting that 1031 exchanges, often involving buyers from outside Texas, represent a substantial percentage of transactions in Texas land markets.
While recreation-minded consumers and investors are dominating Texas land markets, rising corn prices in response to a projected expanding demand for ethanol have prompted farmers to return to the market.
Regional Land Market Developments
In 2006, the geographic distribution of land prices continued to reflect both population density and the draw of scenic amenities (Figure 8). The highest prices surrounded Dallas-Fort Worth, Houston, El Paso, Austin and the Lower Rio Grande Valley. The scenic appeal of the Hill Country generated high prices that stretched westward from Austin through Fredericksburg to Kerrville. The lowest-priced land was within a column running through West Texas from Amarillo to the Trans-Pecos area to the Rio Grande. Most of the higher prices in Texas occur in the heavily populated eastern portion of the state (Figure 8).

The highest percentage price gains from 2005 to 2006 were geographically dispersed (Figure 9). Urban areas near Houston, Dallas and San Antonio all increased more than 30 percent. The Wichita Falls area continued to grow rapidly, as did San Antonio and Fredericksburg.

The largest percentage price jump hit the Trans-Pecos region, where small properties sold in larger than normal numbers, substantially driving up the median price for the area. None of the regions in Texas posted lower prices.
Market developments in 2006 reflected an increasingly intense contest for control of the Texas countryside. Investment-minded buyers continued to pour funds into land purchases and recreational buyers rushed to get in before prices climbed even higher. At year’s end, farmers saw rising corn prices, making land purchases a viable option. Demand for land finished the year strongly.
Remainder of 2007
The forces propelling prices upward have accelerated and expanded in 2007. Markets seem poised to reach even higher levels. Some investors seem to perceive inflation ahead and are searching out tangible assets like land. Tax considerations continue to spark demand for land. The state’s thriving economy continues to increase incomes, which are supporting demand for recreational property.
Ethanol-fueled corn prices are spurring farmers to buy land. Meanwhile, institutional and foreign investors have developed an appetite for Texas forest land. These circumstances have led market participants to repeatedly note a dearth of quality listings and brokers to maintain long lists of potential buyers.
Market observers and participants alike express growing apprehension about the near-frenzied atmosphere of the Texas land market. Noting an increase in borrowing among buyers and the high rate of price increase, many fear that current price trends will be unsustainable in the long run. Some note isolated instances of developers backing away from proposed land purchases. Peering ahead, a number of potential pitfalls appear on the horizon.
High energy prices could adversely impact the demand for recreational and development land. Further interest rate hikes may take a toll. Farm policy is in complete disarray, so no one can realistically predict operating conditions for farmers in the near future. Despite these potential problems, current activity suggests that by the end of 2007, Texas land prices should post another sizable increase.
Regional Developments
The following land market areas (LMA) registered especially strong (statistically significant) trends compared with 2005 market levels in. In addition to these land market areas, all regions experienced price increases in 2006. The local developments reflected a voracious appetite for land coupled with a limited supply of listings. The following analysis notes some of the forces driving those trends. Table 2 contains detailed statistics documenting regional developments.
LMAs 8, 12, 16, 18, 24, 28, 32 and 33
These geographically dispersed areas were the hottest markets in 2006, all registering price increases greater than 30 percent. Markets reflecting these trends evidenced:
- a marked increase in use of leverage as more buyers borrowed to purchase,
- increased competition among lenders,
- disappearing distinctions between the price per acre for small and large properties,
- premium prices paid for both attractive and plain properties,
- available property inventory continuing to be tight and
- non-Texan buyers continuing to view land prices as bargains.
LMAs 6, 13, 14, 15 and 27
The second hottest regional markets in 2006 saw percentage increases ranging from 25 to 29 percent. Slightly more removed from the urban influences of the larger cities, these areas evidenced the strong demand for land.
- Prices throughout this region experienced a dramatic rise.
- Recreational and investment purchases drove prices.
- Purchases with 1031 exchange money were significant.
- Buyers from metropolitan areas expanded into much of this area in search of cheaper land.
- Markets were active.
LMAs 7, 11, 17, 20, 22 and 23
These booming regions evidenced substantial demand pressures even as prices rose more quickly elsewhere. With percentage increases ranging from 20 to 22 percent, many of these areas experienced very strong growth in 2005 only to see a somewhat less sanguine market in 2006.
- At $7,086 per acre the Kerrville area posted the highest median price in Texas.
- These markets saw continued interest in recreational properties.
- Investors appetites remained strong.
LMAs 1, 4, 9, 10, 19, 21, 25, 29 and 30
Prices in these areas grew between 4 and 19 percent in 2006 and experienced general continued growth of demand for land in 2006.


