Texas Land Market Developments 2011
Total Texas land sales in 2011 were below normal for the third straight year. Large tract sales were scarce. The Texas land market reflected the turmoil in the financial arena, and uncertainty and high commodity prices fueled strong demand for cropland.

Summary
- Sales volumes lagged recent market norms for the third straight year.
- Texas markets struggled to post a small gain with a continuing dearth of large tract sales. Gains appeared to be concentrated in West Texas, the Panhandle and High Plains.
- Markets continued to reflect turmoil in financial markets and persistently high unemployment rates.
- Uncertainty and high commodity prices continued to fuel strong demand for cropland. However, the epic drought and anticipated changes in farm support payments may threaten to derail investment demand for land.
- Small properties sold well, but demand for large tracts continued to be sluggish, with buyers holding out for bargains.
- For the third straight year, fewer acres than historic patterns forecasted changed hands in Texas.
- Oil prices and expanding production helped buoy Texas markets.
- Future economic shocks could derail the land price recovery.
2011 Overview
Texas regional land market price trends in 2011 reflected variations in market dynamics. Continued demand for secure investments sustained increasing prices for cropland. Market pressures were especially strong in irrigated cropland markets. Those pressures also helped to modestly boost the overall statewide price level.
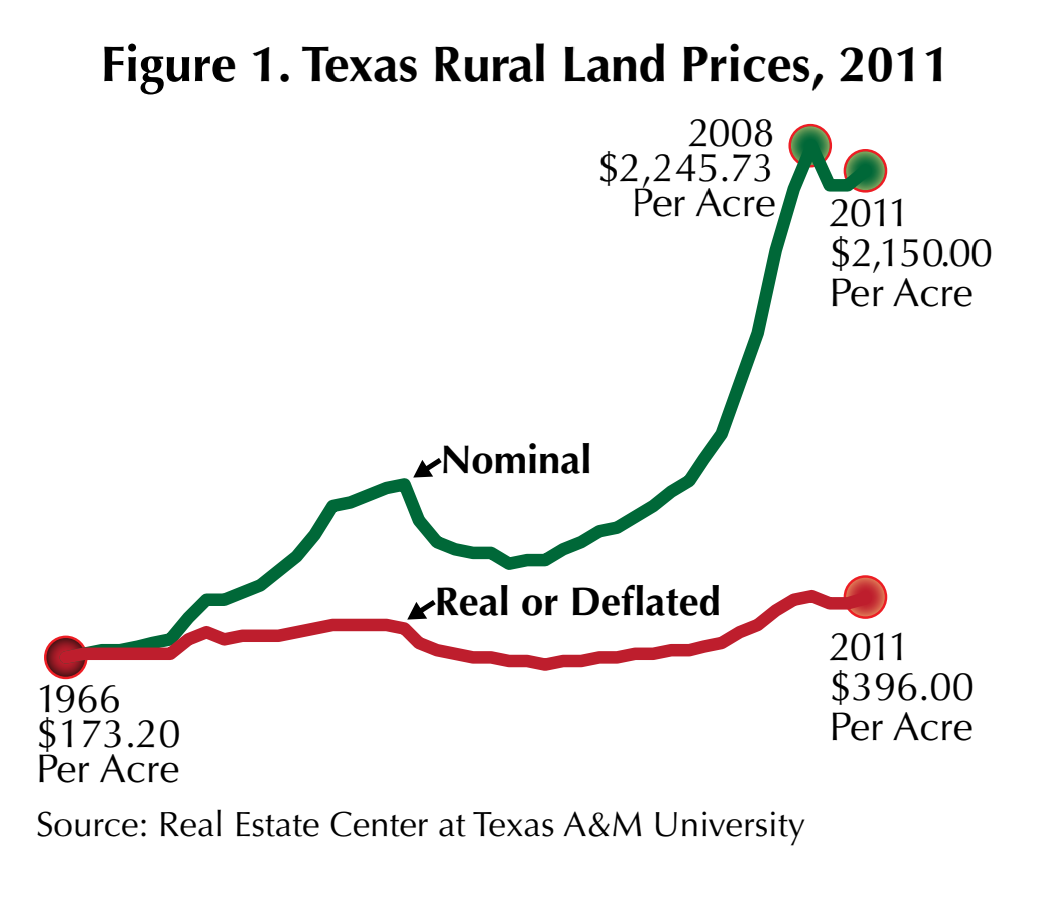
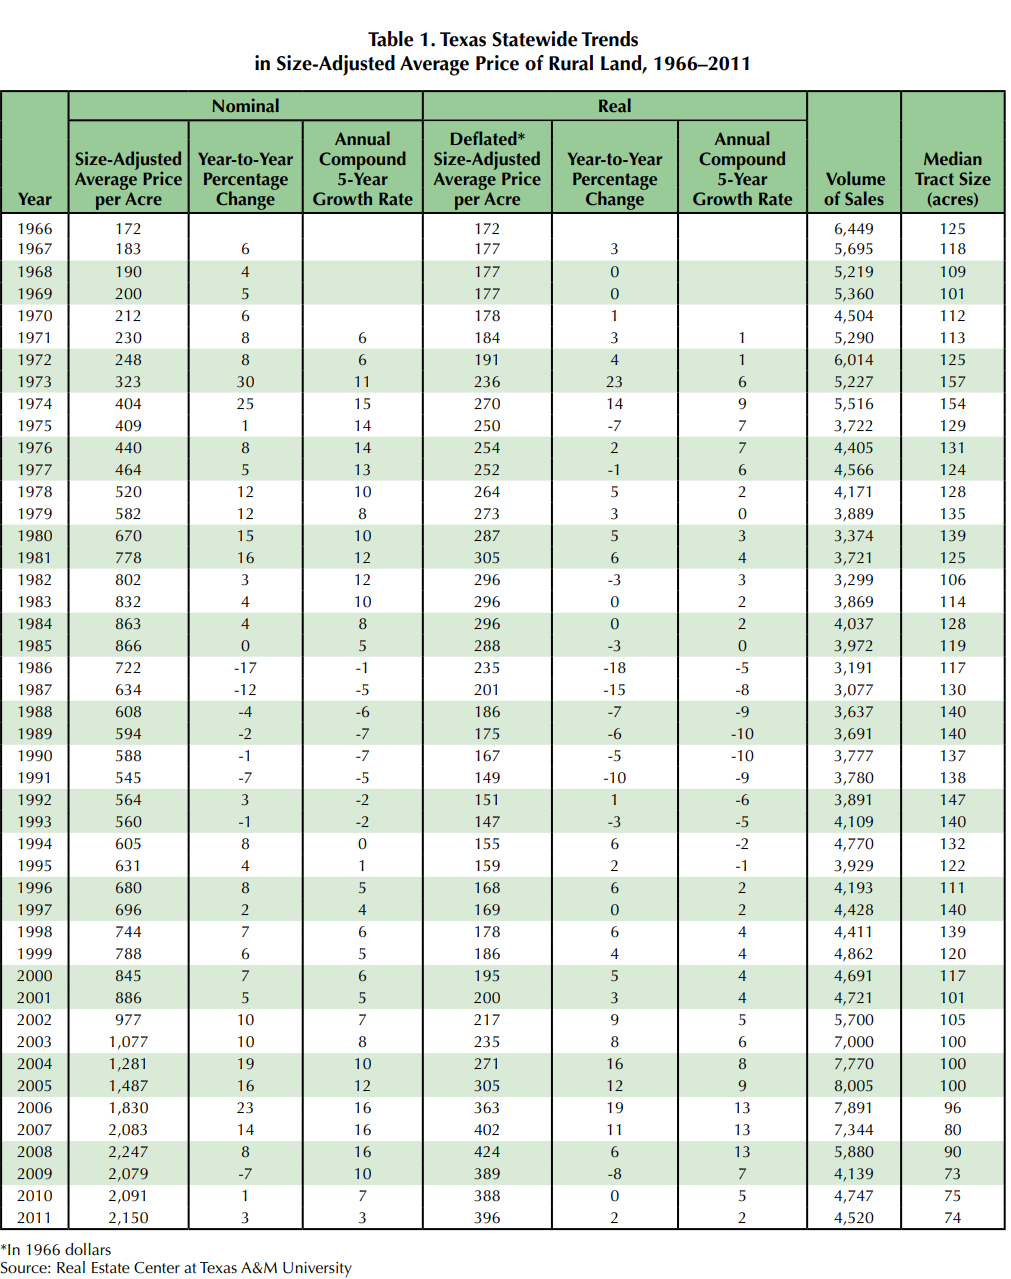
Markets were plagued by a slow volume of activity. The more urban-oriented areas in the northeast and far south Texas posted weaker prices. Demand for transitional and development tracts weakened and recreational land buyers were scarce. This mixed bag of results led to a 3 percent overall increase in the statewide price of $2,150 per acre compared with the 2010 year ending price of $2,091 per acre.
The real or inflation-adjusted price of $396 per acre in 1966 dollars continued below the 2008 record level of $424 but marked a 2 percent rise over the 2010 annual price. That resulted in the first increase in real price since 2009. Nominal prices shown in Figure 1 and Table 1 reflect the actual prices paid while real prices represent those nominal prices adjusted for inflation.
Tract Size
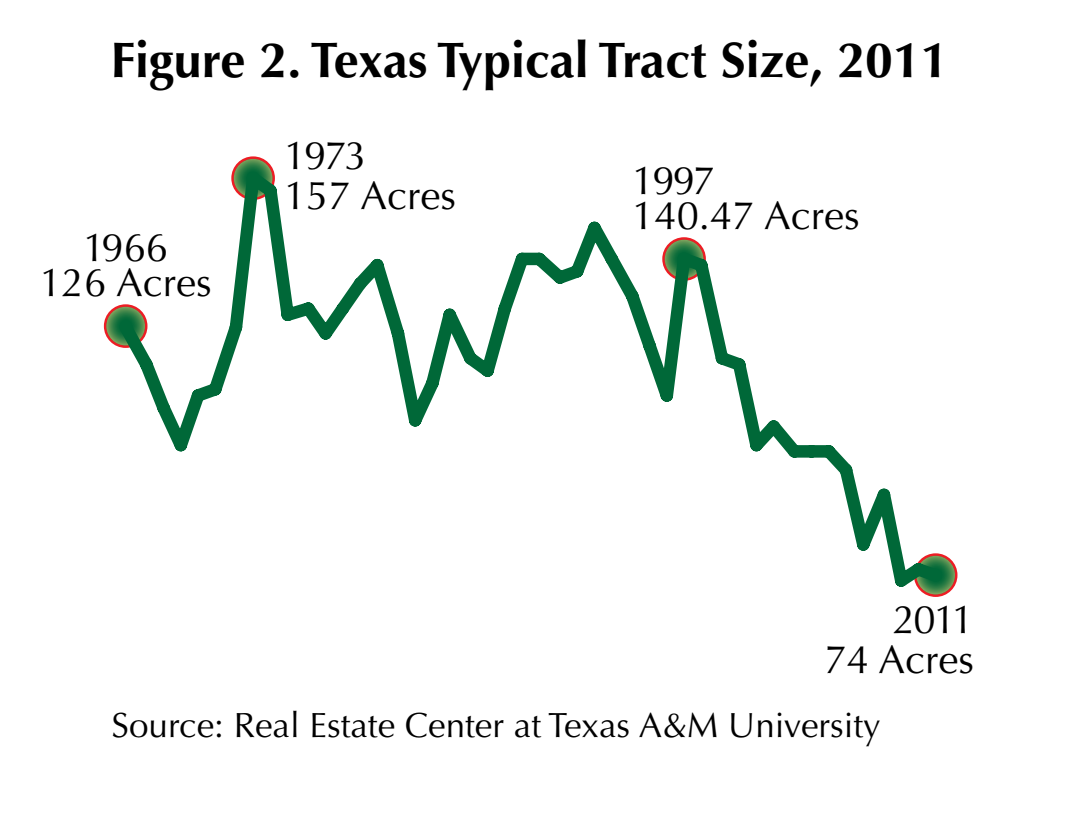
Small-sized transactions continued to dominate the overall market as the 2011 median of 74 acres nearly matched the 2010 typical size of 75 acres (Figure 2). That size remains well below the 100-acre levels seen from 2000 to 2005.
The number of large property sales remained depressed. Brokers in the field reported that the impasse over pricing continued between potential buyers and sellers of sizable tracts in 2011. However, a small number of wealthy individuals have reportedly begun to buy very large, top-quality working livestock operations.
Sales Volume
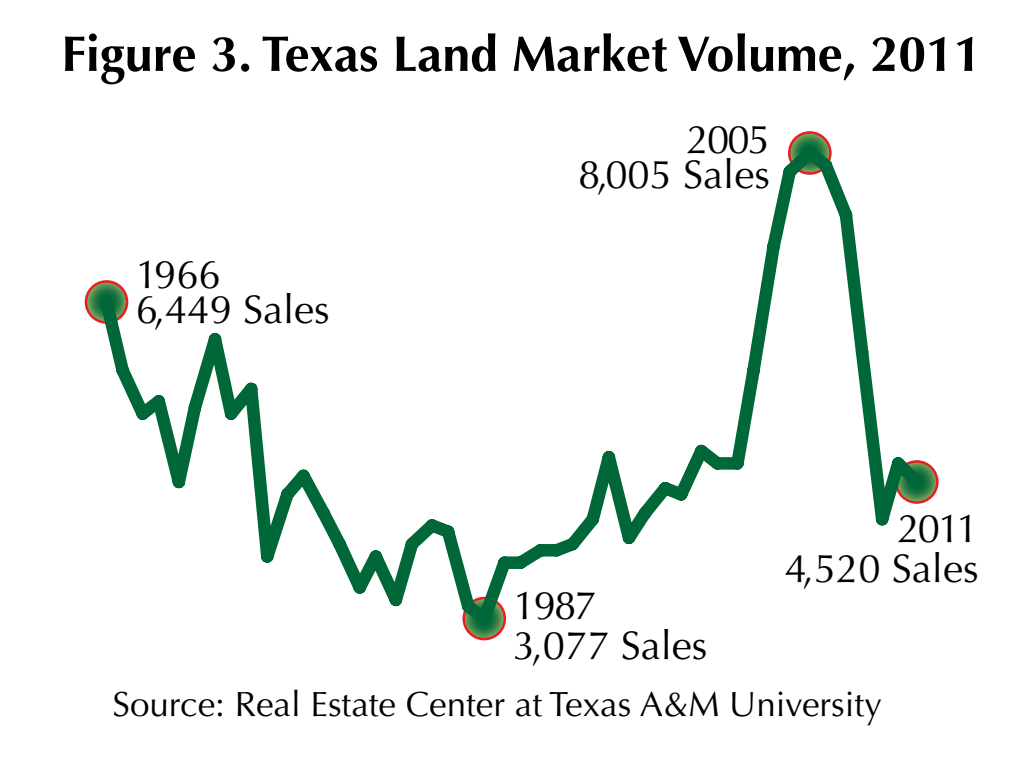
The 4,520 sales reported in 2011 fell just short of the 2010 volume of 4,747 (Figure 3). If the level of reported sales is indicative of current market activity, volumes have returned to late ’90s levels. The year-to-year annualized trend in number of sales statewide trails 2010 levels by just 4.7 percent.
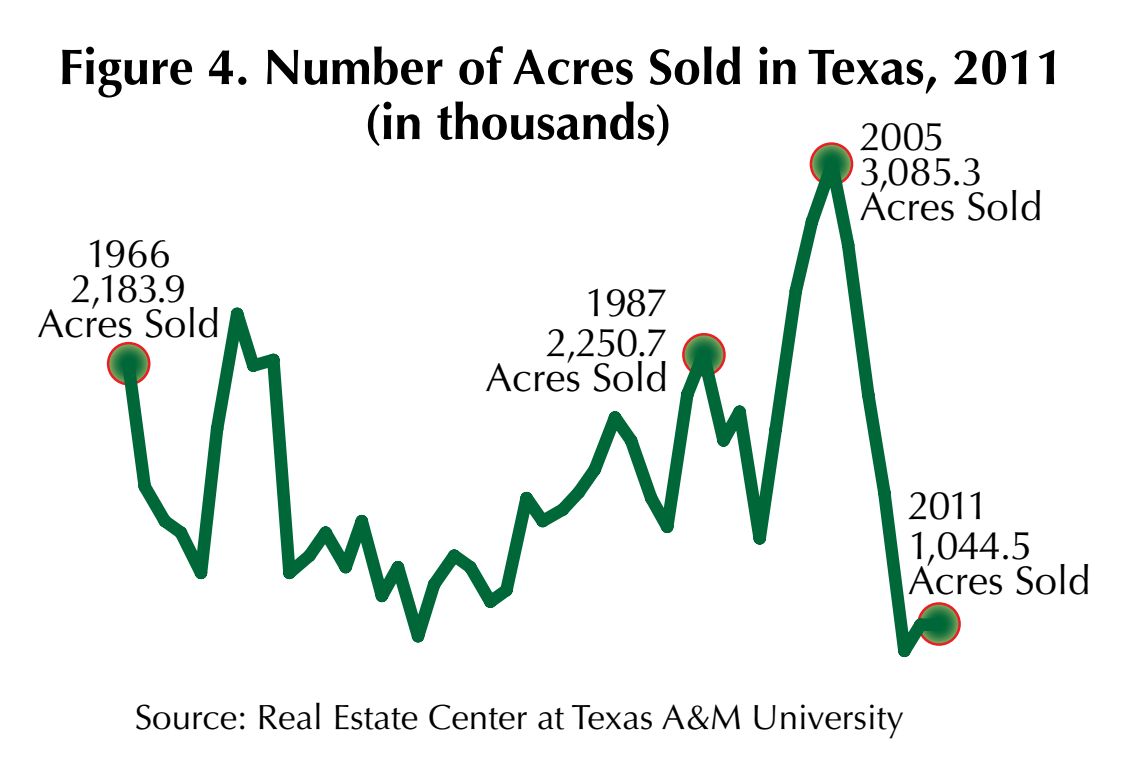
Sales in 2011 transferred a total of 1,044,474 acres (Figure 4). That compares with 1,052,957 acres in 2010 and contrasts with 3,085,339 acres posted in 2005. The reduction in the number of acres transferred began at the end of 2008 and continues at low levels in current markets.
Future Trends
Texas land markets registered mixed results in 2011. Renewed interest in cropland combined with a fear of inflation in the future provided upward pressure on cropland prices. However, for the third straight year, large properties sold less frequently than in past years. Sale volumes continue to drop and nearly matched volumes last seen from 1990-2000.
These facts reinforced information gathered from appraisers and brokers who reported potential buyers continued to make low offers, presuming that prices will eventually drop. Buyers were still hesitant to pay current prices, but increasing numbers have grown weary of delaying purchases. Vibrant cropland markets were the exception, with eager buyers bidding for a restricted number of properties for sale.
Barring any significant shock to the economy, firming market prices will likely hold or increase in many locations. But a glance at the numbers of acres represented by properties sold in Texas indicated that markets continued to see an unusually low number of acres change hands, a condition that has held for three straight years. This suggests that the uneasiness abroad in the economy stemming from the problem of excessive debt worldwide is creating turmoil in many markets. These disquieting forces created a heightened apprehension of risk and suggest that buyers will continue to expect price erosion while sellers resist sales at prices below recent historical norms.
What’s Ahead
Anecdotal evidence gathered from appraisers and brokers suggest that cropland investors will continue to seek land. However, the dismal yields that followed last year’s historic drought and the threat of substantial changes to government crop supports may weaken demand.
Rangeland markets face formidable challenges as the battle rages on between buyers waiting for lower prices and sellers refusing to accept low-priced bids. Transitional tracts near urban areas face slack demand over the coming year.
By contrast, bustling activity in the Eagle Ford Shale continues to inject cash into Texas communities. Mineral producers and royalty owners have realized substantial profits with no end in sight. Evidence is beginning to emerge that some of this prosperity will be focused on land.
These positive forces may overcome difficulties dragging down economic activity and inspire a modest increase in land prices in the coming months. Even so, sales volume will likely continue at muted levels.
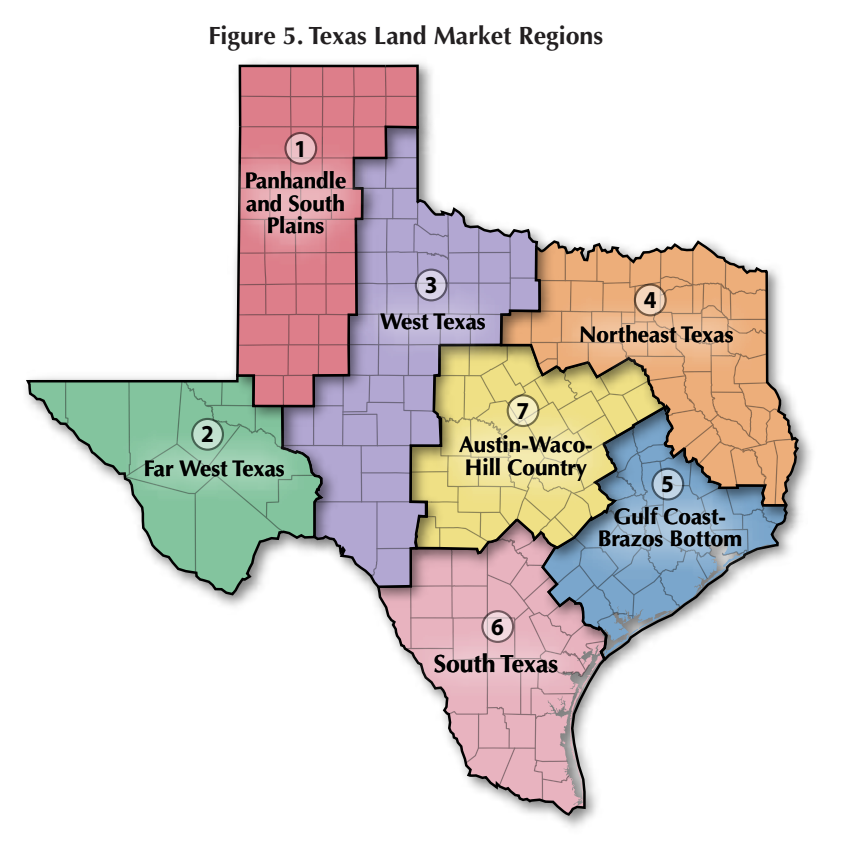
The Panhandle, West Texas and Wichita Falls areas posted price improvements, while northeast and Central Texas prices lagged behind 2010 levels (Figure 5, Table 1).
Region 1 — Panhandle and South Plains
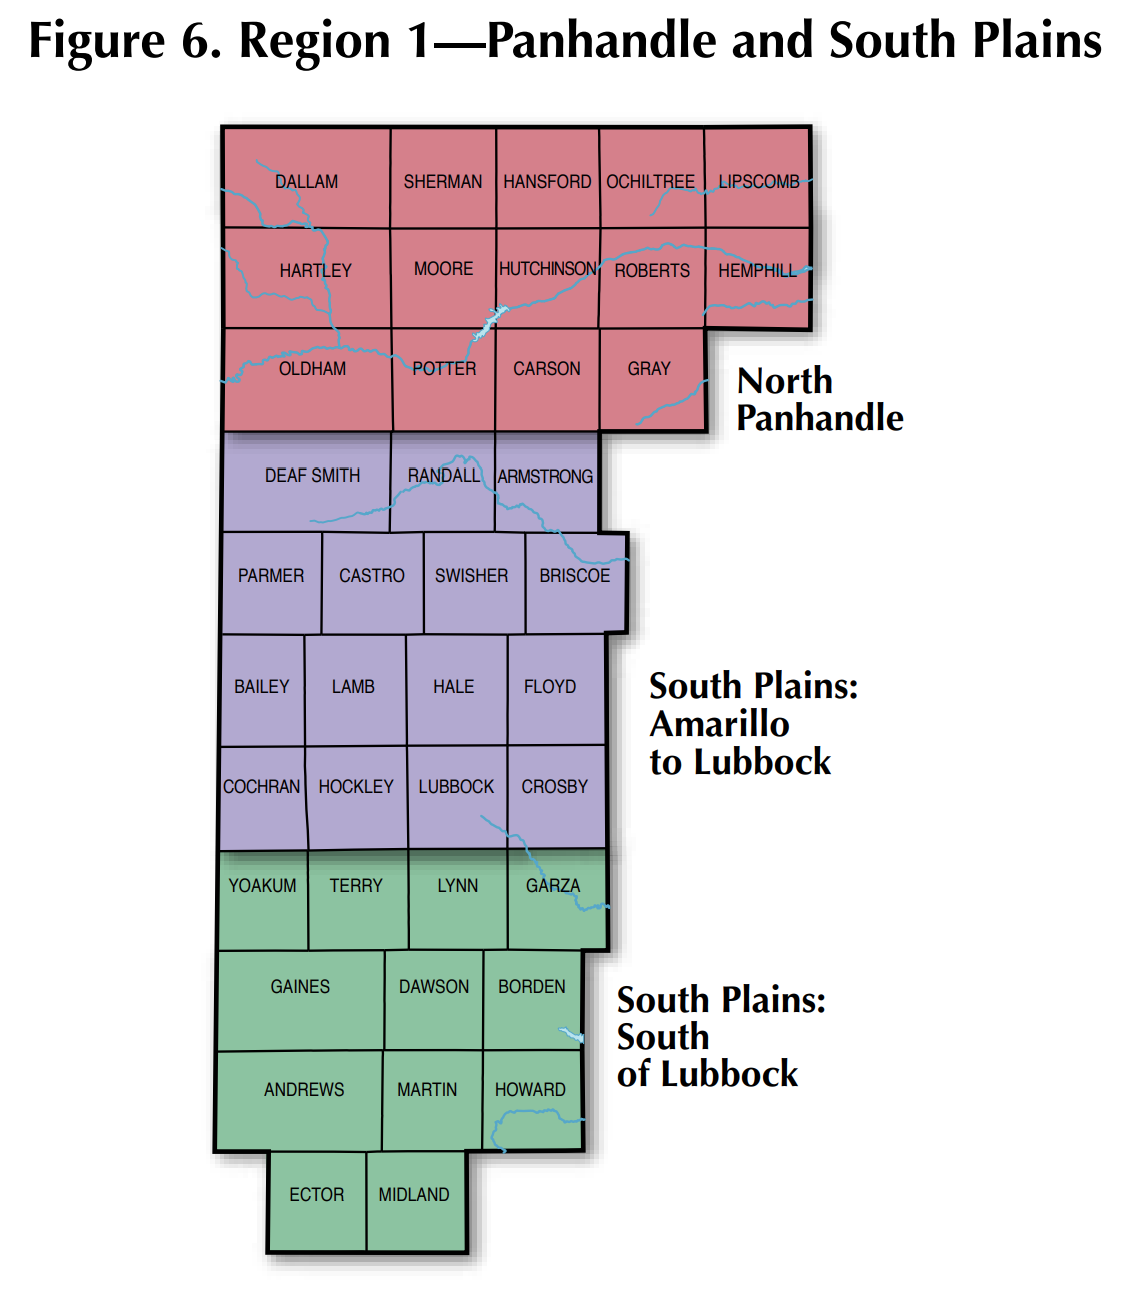
More than any other region in Texas, the Panhandle and South Plains is dominated by farming. It encompasses the greatest concentration of cropland, accounting for 62 percent of irrigated acres and 41 percent of dryland acres statewide (Figure 6).
Activity in farmland markets made 2011 a remarkable year for both buyers and sellers. Specifically, the continuing robust demand for cropland boosted regionwide land prices to an all-time high of $946 per acre in 2011, a 20 percent increase from 2020 price levels (Figure 7). However, that price measured in real 1966 dollars settled in at $174 per acre, failing to top price levels seen from 1974 to 1982 (Table 2).
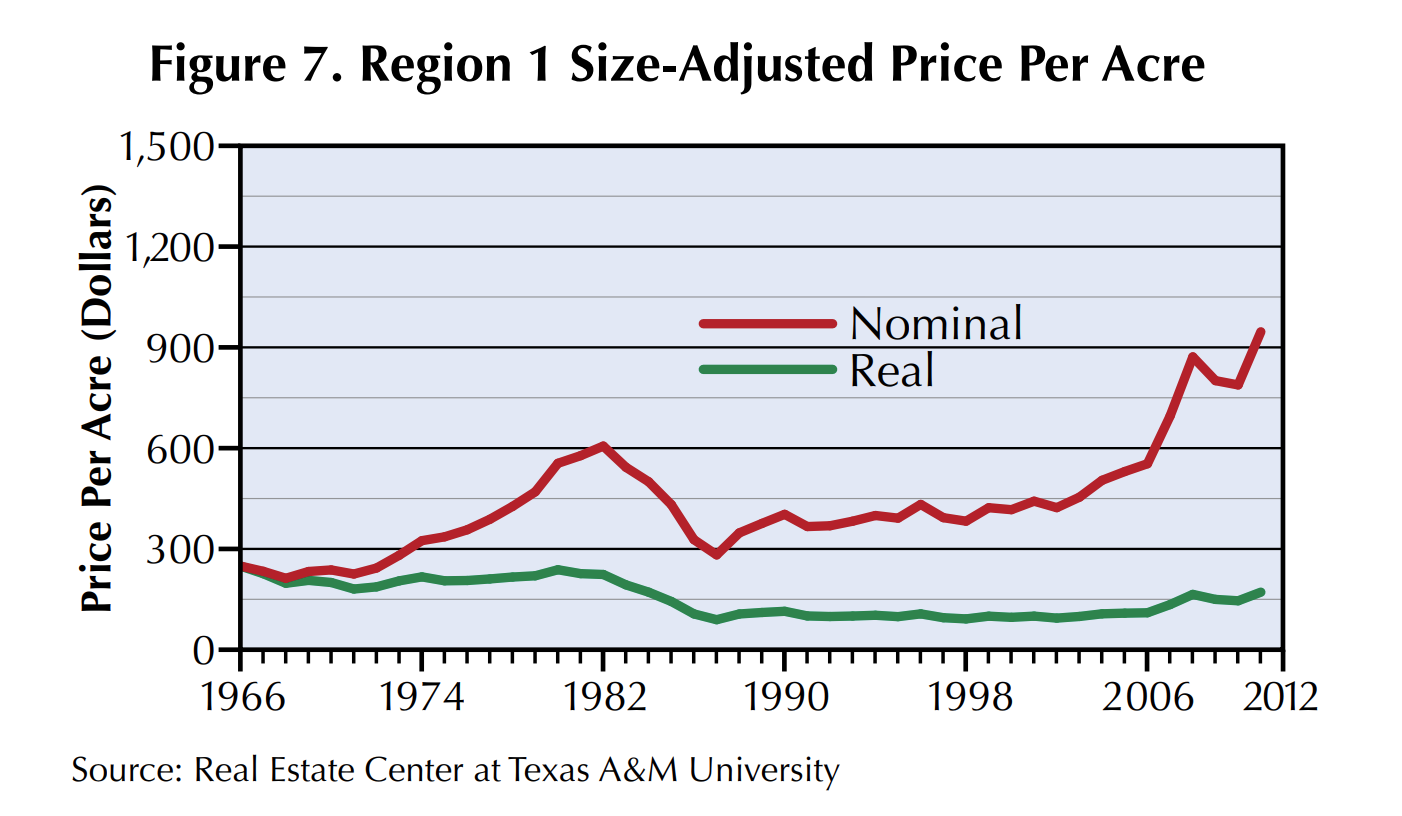
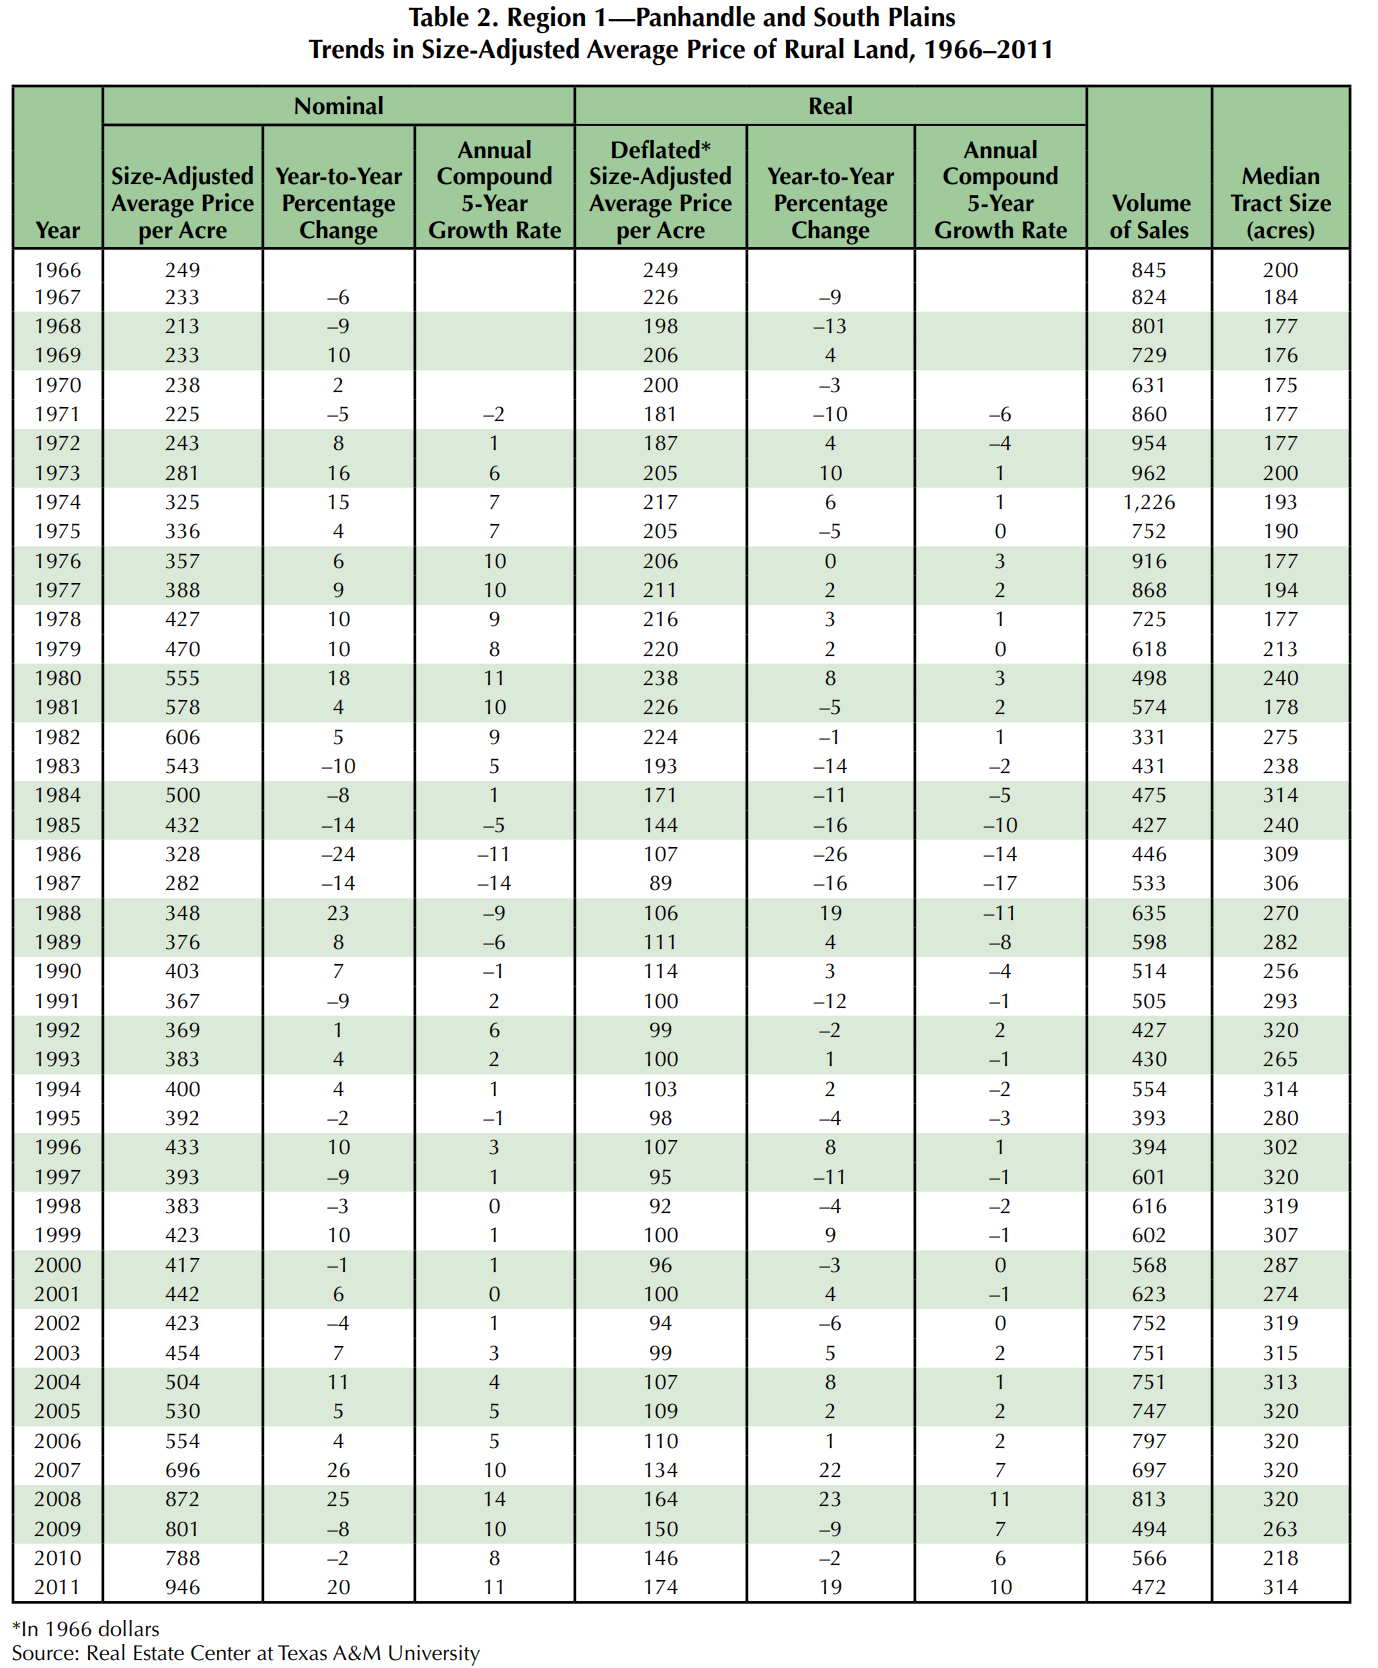
At 472 reported sales, volume of activity lagged below the long-term average. However, the slow pace of sales occurred partly because high commodity prices prompted many current owners to refrain from selling. That left would-be buyers to compete for limited available supplies.
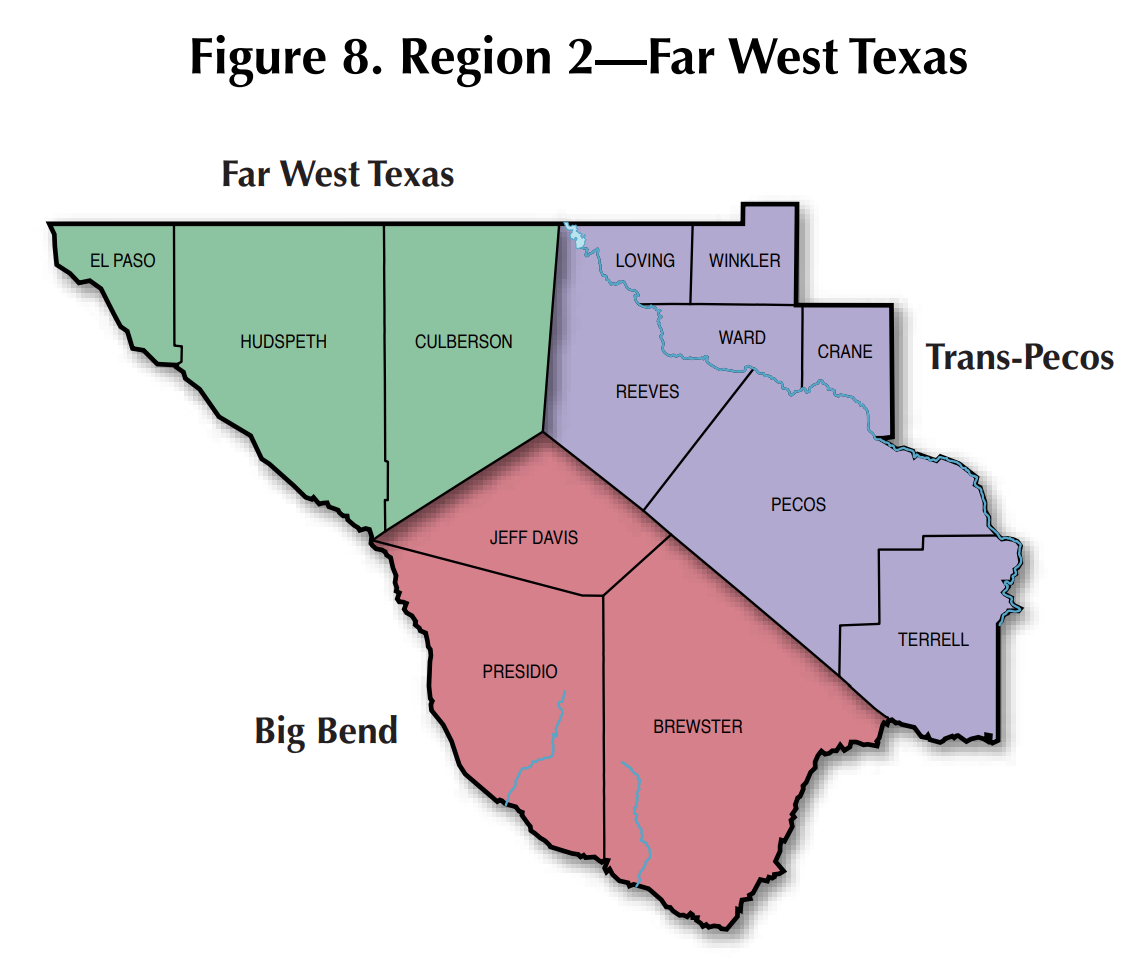
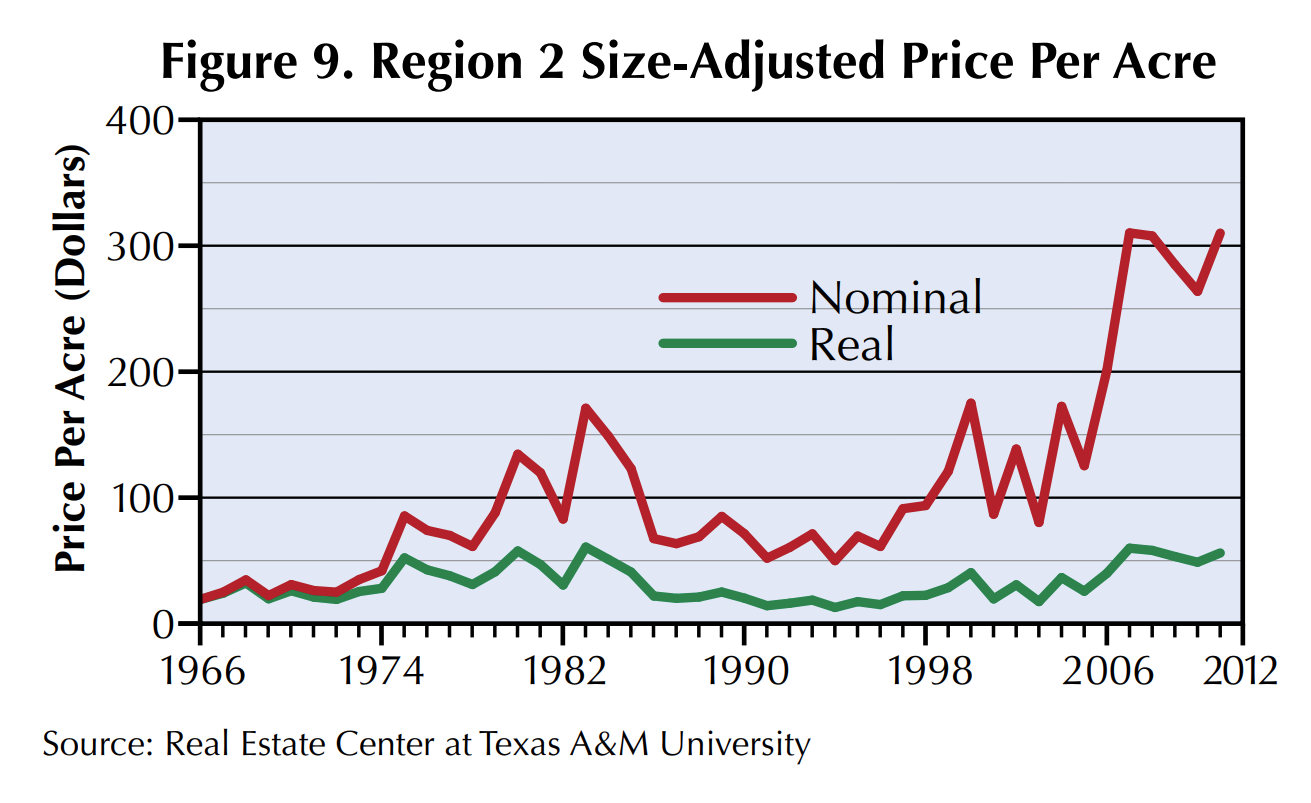
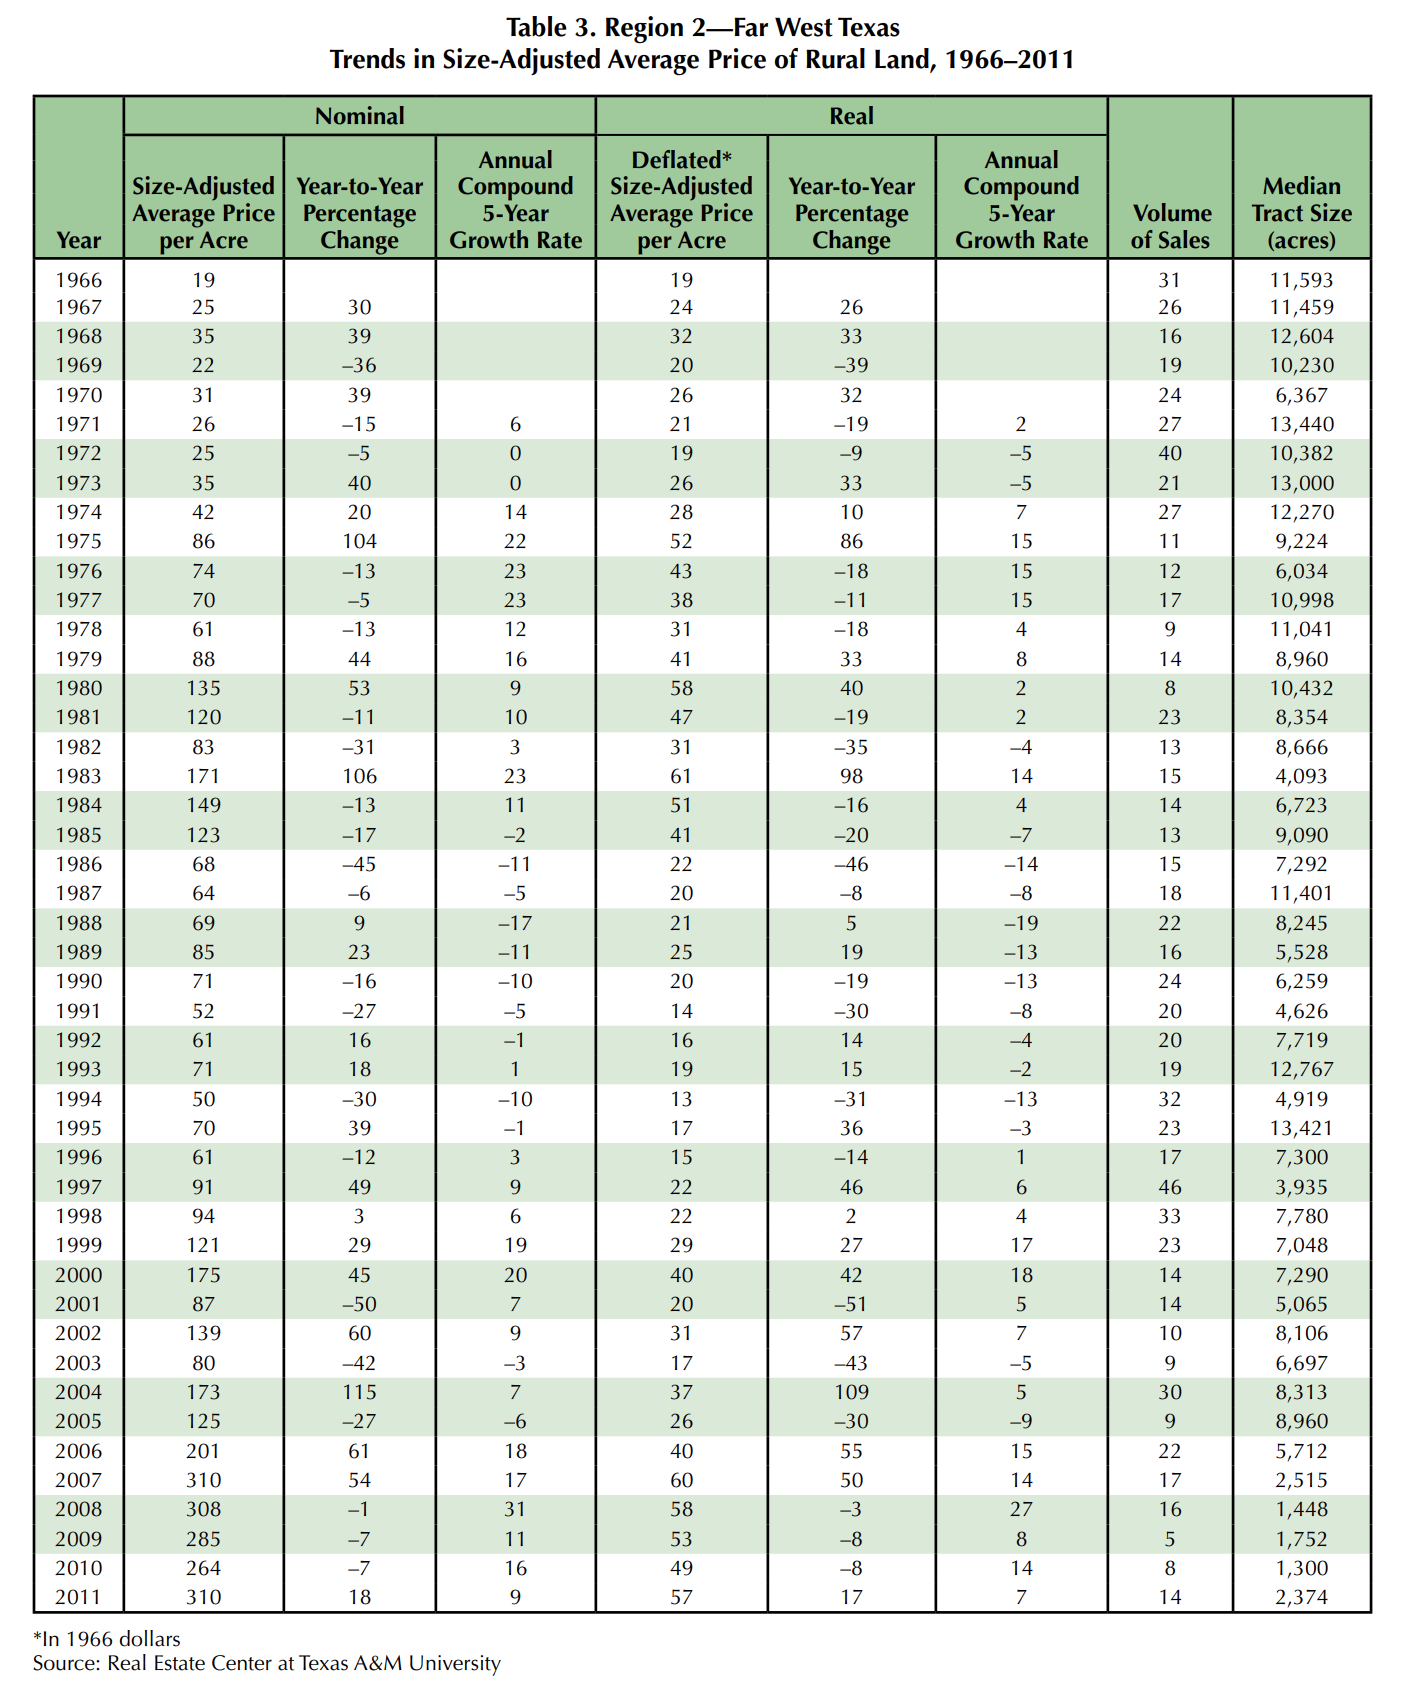
Region 2 — Far West Texas
With vast expenses of arid land, this region typically books few sales and has large price variations. Desert rangeland normally sells at low prices per acre in large tracts while the available irrigated farmland commands relatively high per-acre prices (Figure 9, Table 3). The small number of sales reported in this region means the data are not a strong indicator of land prices in the area.
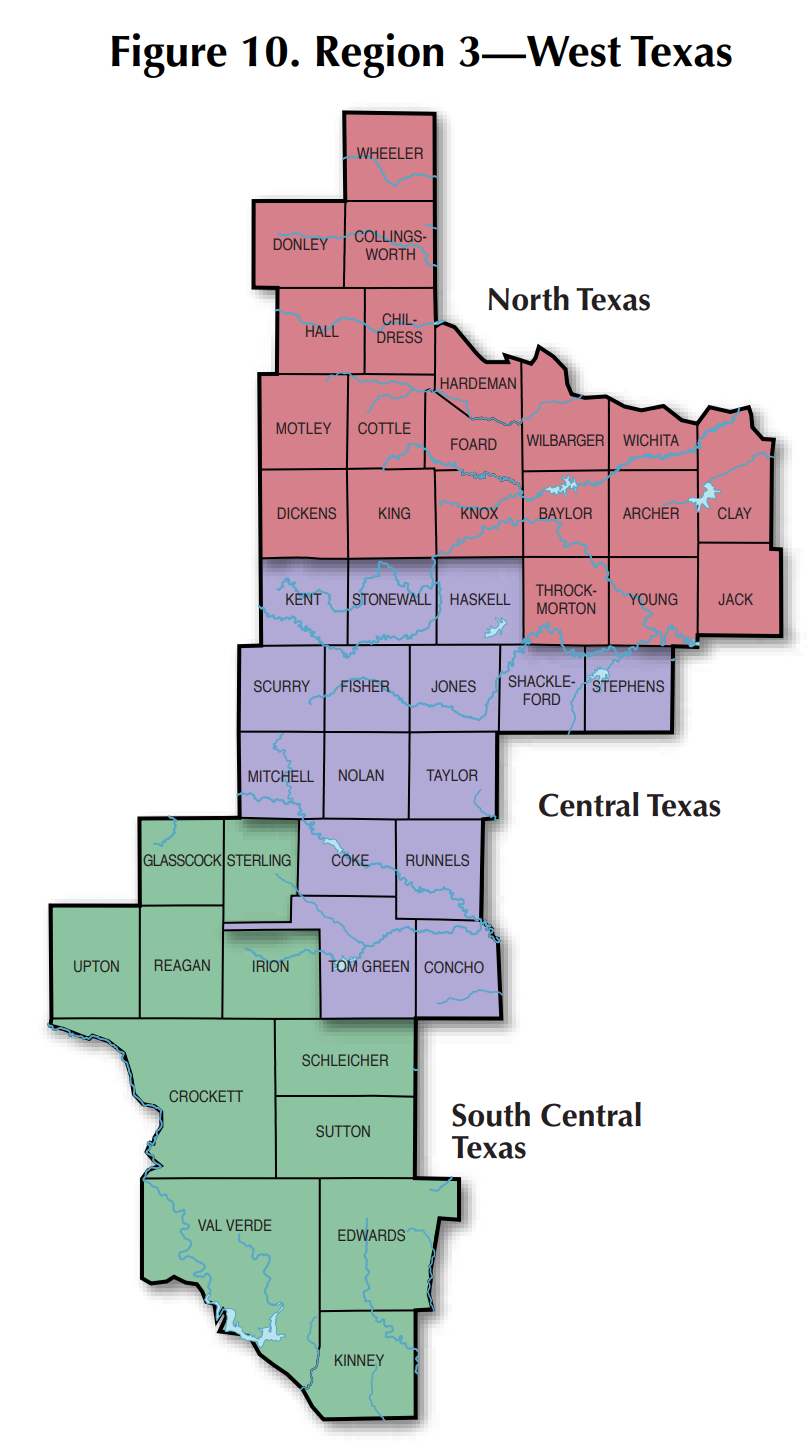
Region 3 — West Texas
Native range dominates this region, accounting for nearly 77 percent of total acreage. In addition, the area contains a substantial farming presence (16 percent of total acreage) mostly focused on dryland cropland (Figure 10).
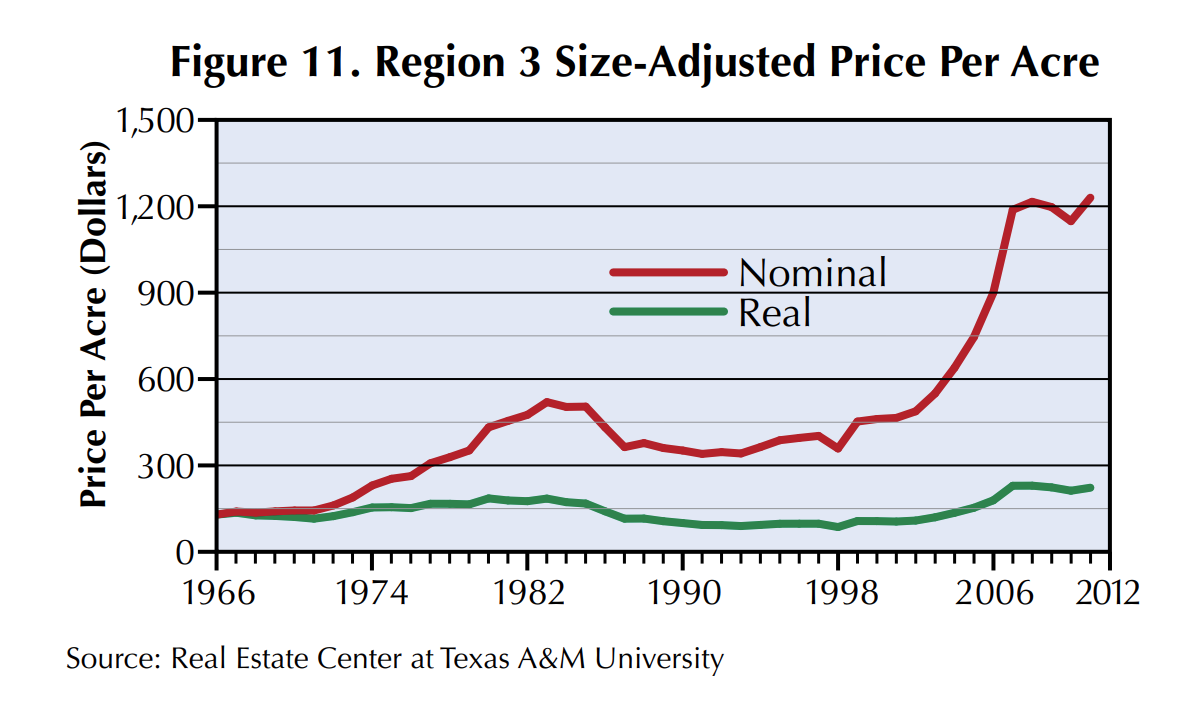
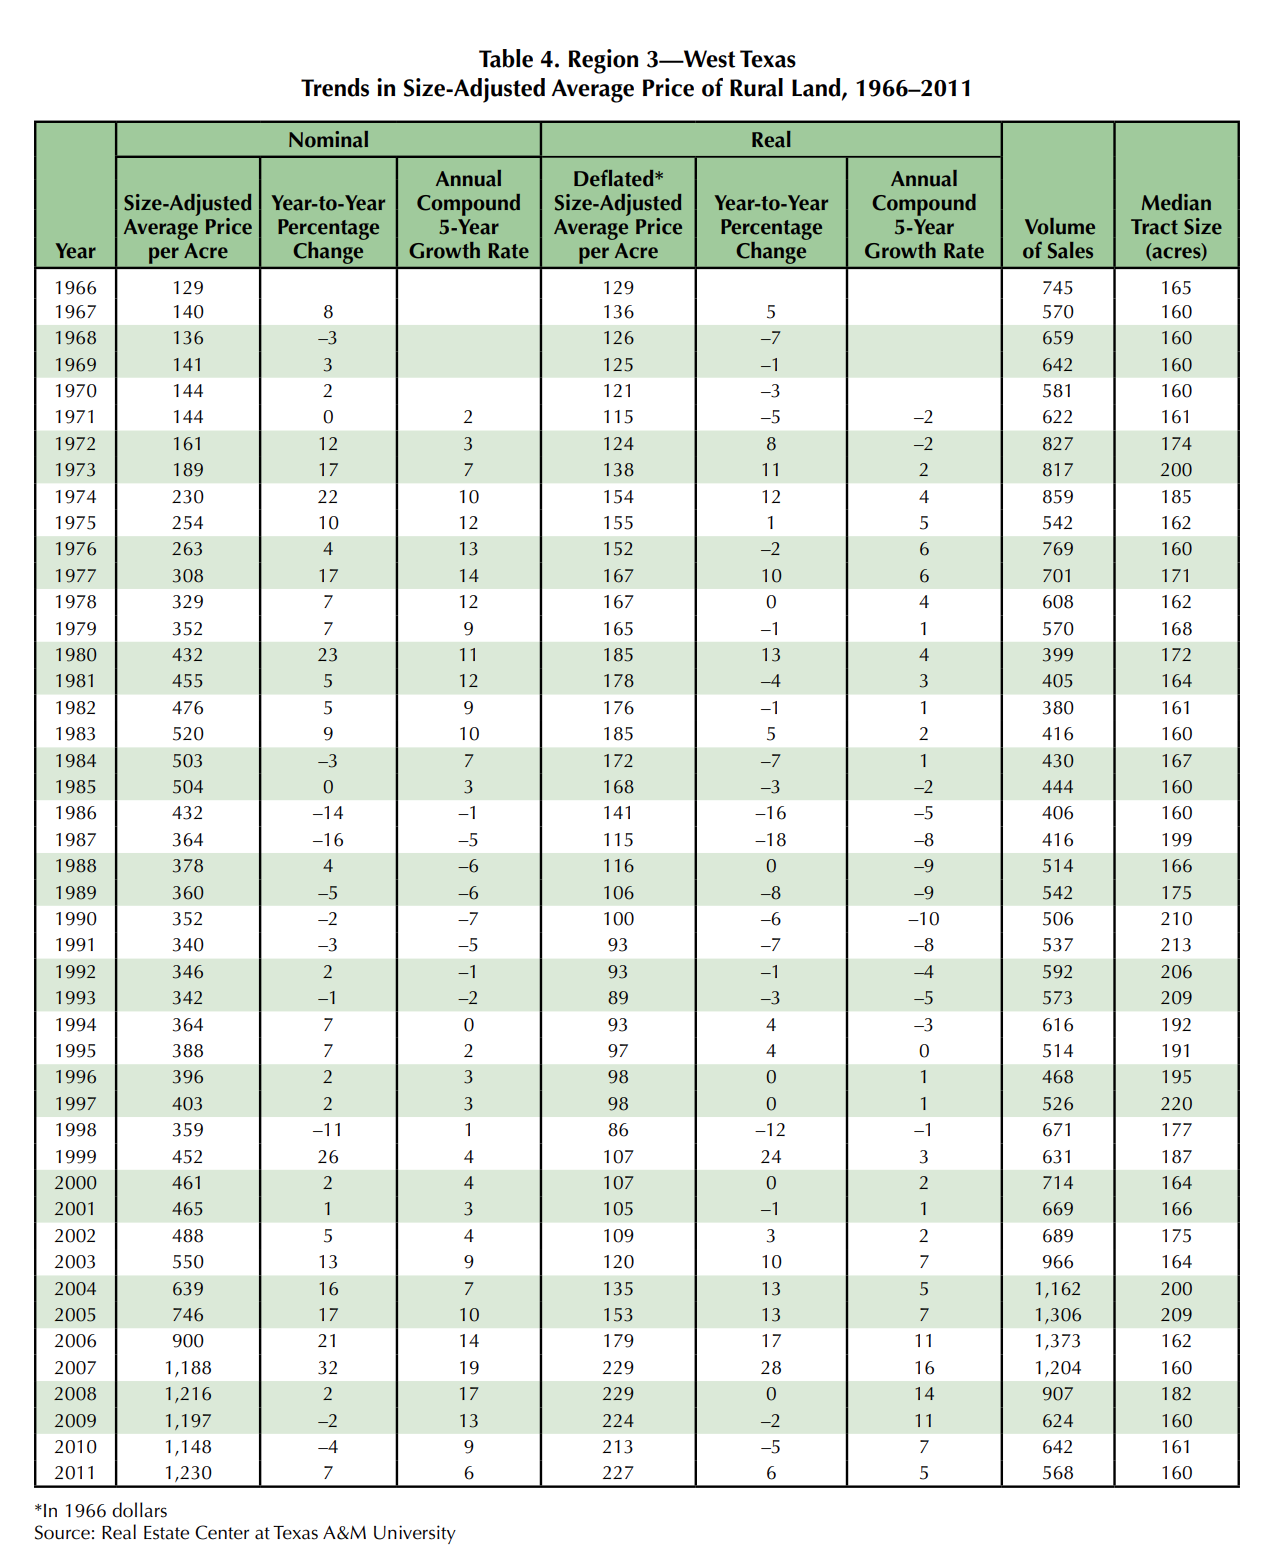
Interest in cropland and rangeland provided a lift to regional land prices, raising the average price 7 percent to $1,230 per acre. That increase followed two years of declining prices (Figure 11). The recovery was narrowly focused, however, posting only 568 sales, the lowest volume since 1997. Typical tract size remained steady at 160 acres.
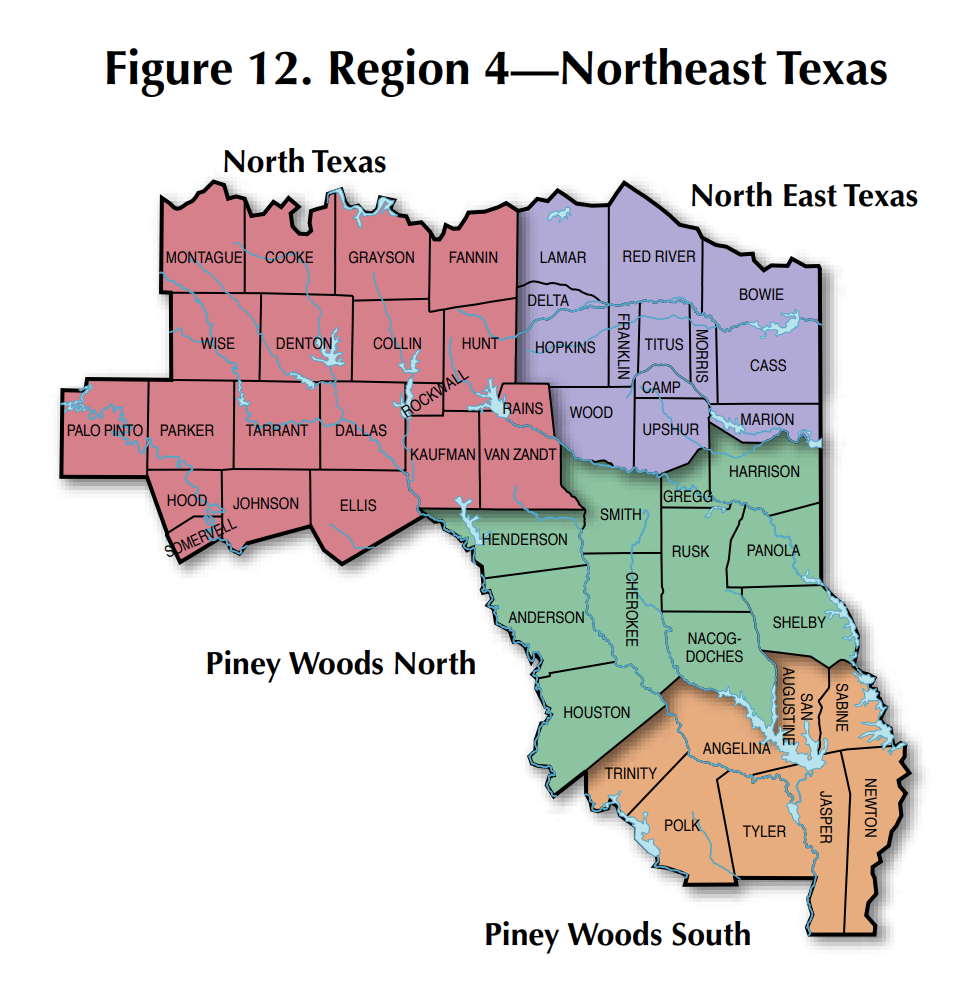
Region 4 — Northeast Texas
Rural land markets in this region reflect influences from its sizable and growing urban areas (Figure 12). Demand for recreational use competes with timber production. More than 57 percent of the area is used for grazing, while 33 percent is dedicated to timber production.
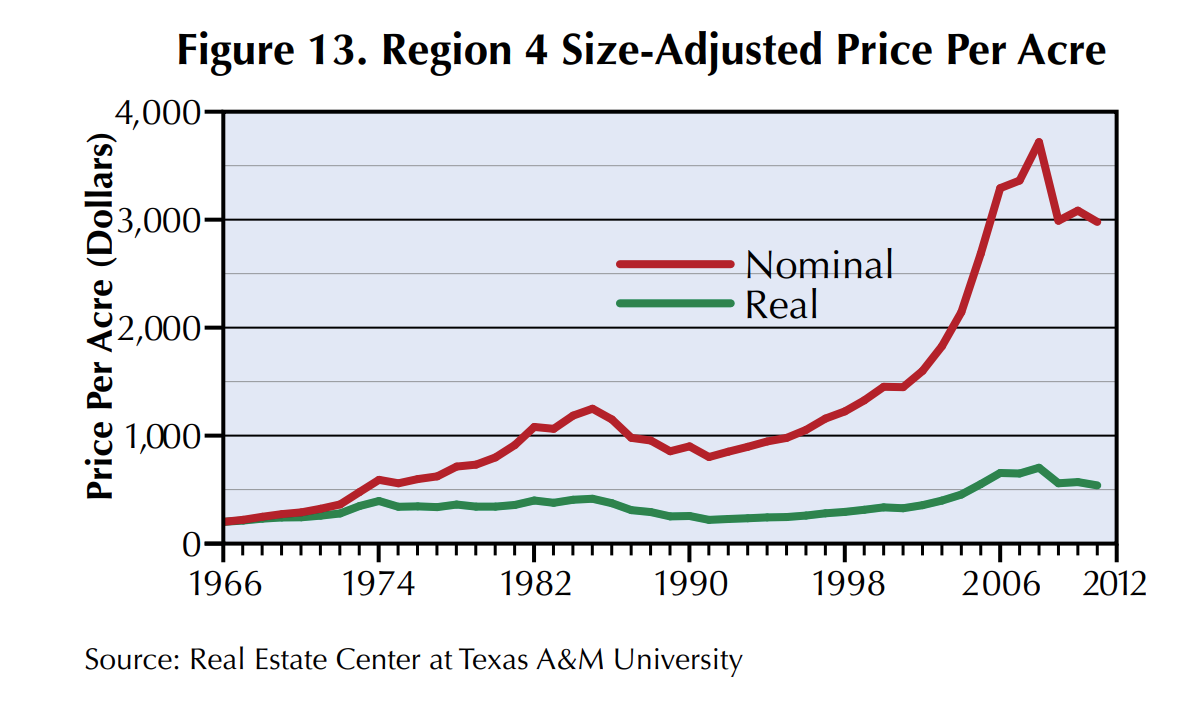
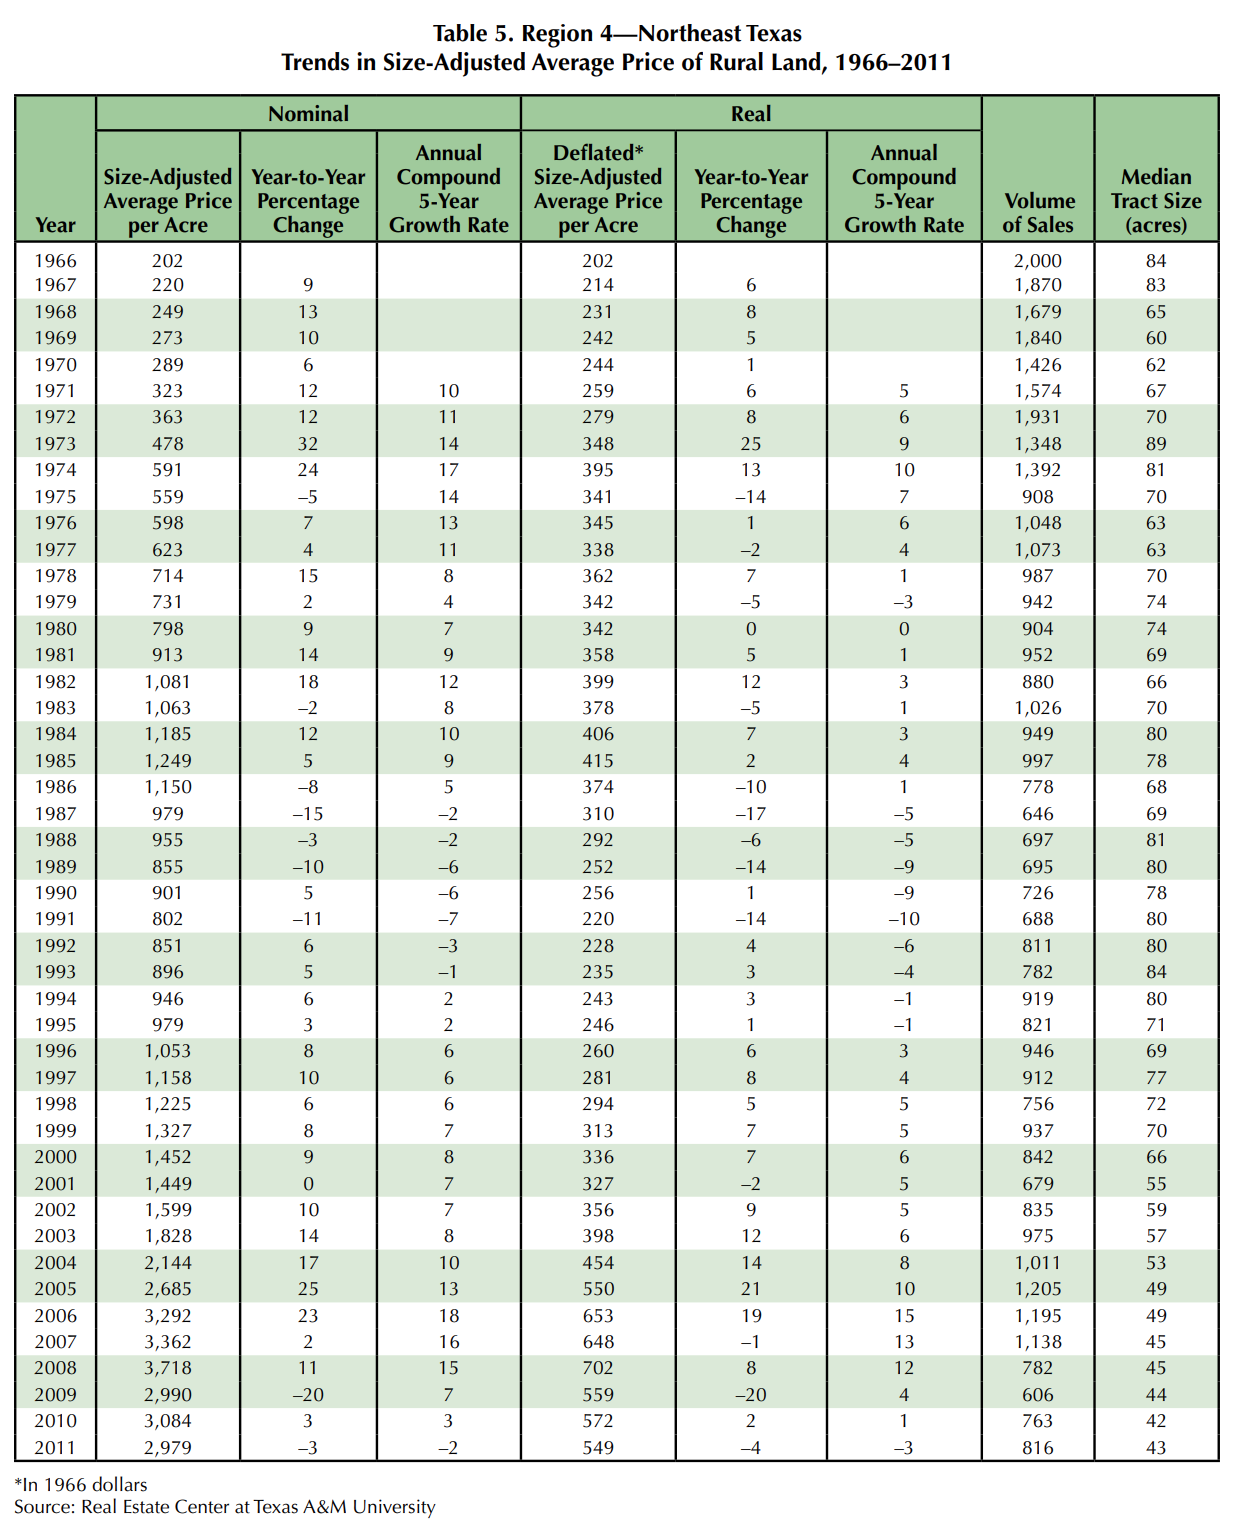
After suffering a sizable drop in price per acre in 2009 as recession plagued the economy, the trend seemed to ease in 2010 only to drop back to $2,979 per acre in 2011 (Figure 13, Table 5). In real terms, that average price matched the price posted in 2005.
Sales activity expanded to 816 sales from the meager 606 sales in 2009 but remained well below 2004-06 volumes, which exceeded 1,000 sales. The 3 percent price decline suggests that recessionary forces continued to dampen demand in this region.
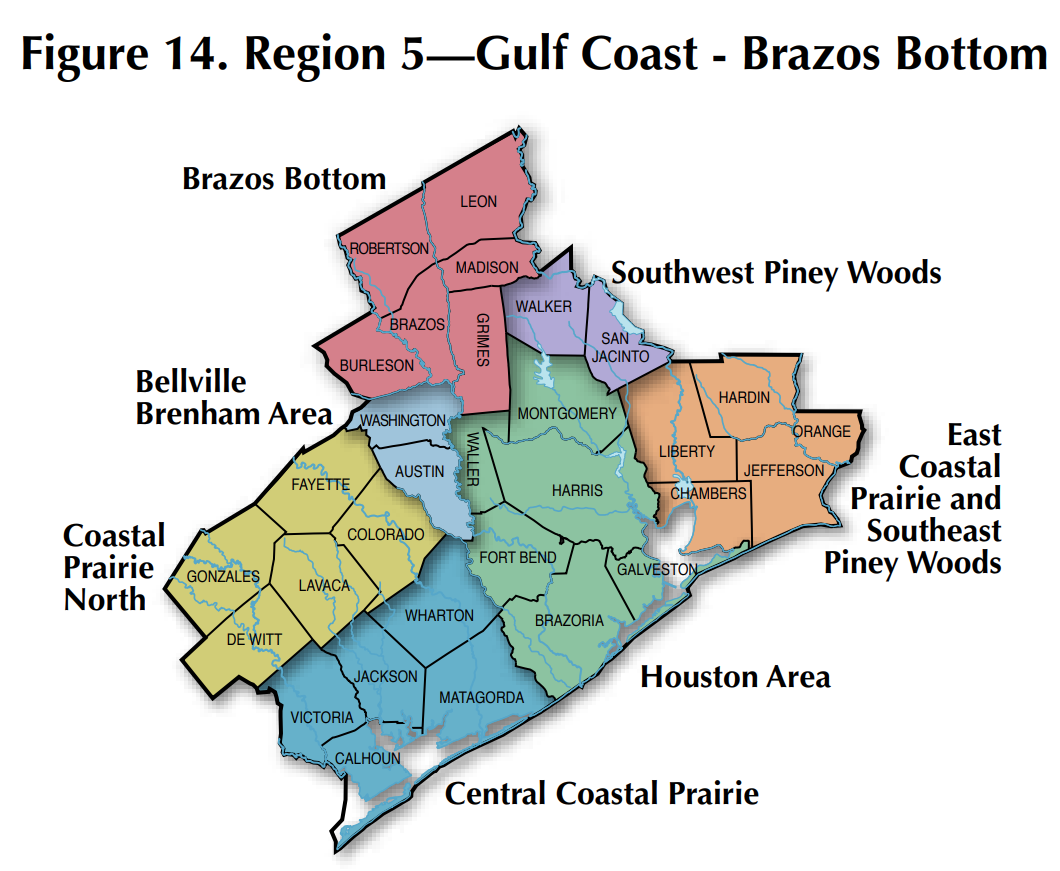
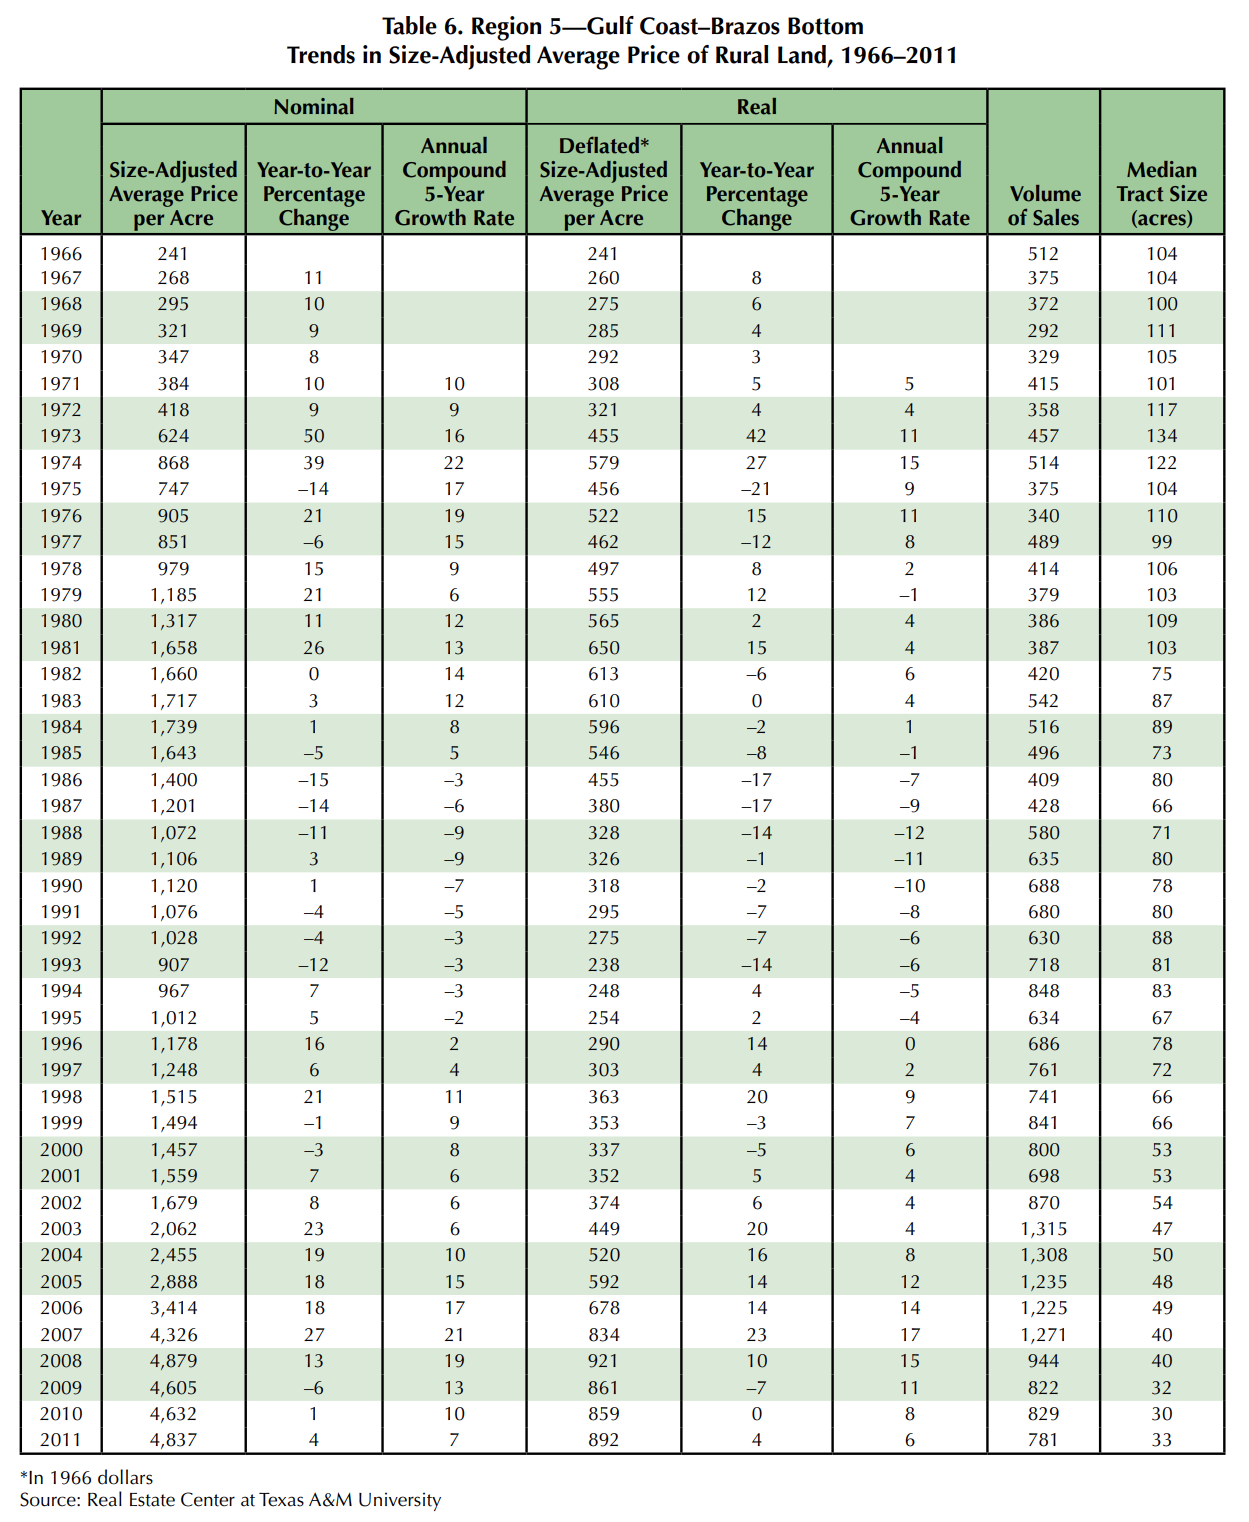
Region 5 — Gulf Coast-Brazos Bottom
Landowners in this region maintain 58 percent of rural land in its native range state with an added 14 percent dedicated to improved pasture (Figure 14). Although pockets of timber and cropland dot the region, urban development and expanding population centers drive much of the demand in this area.
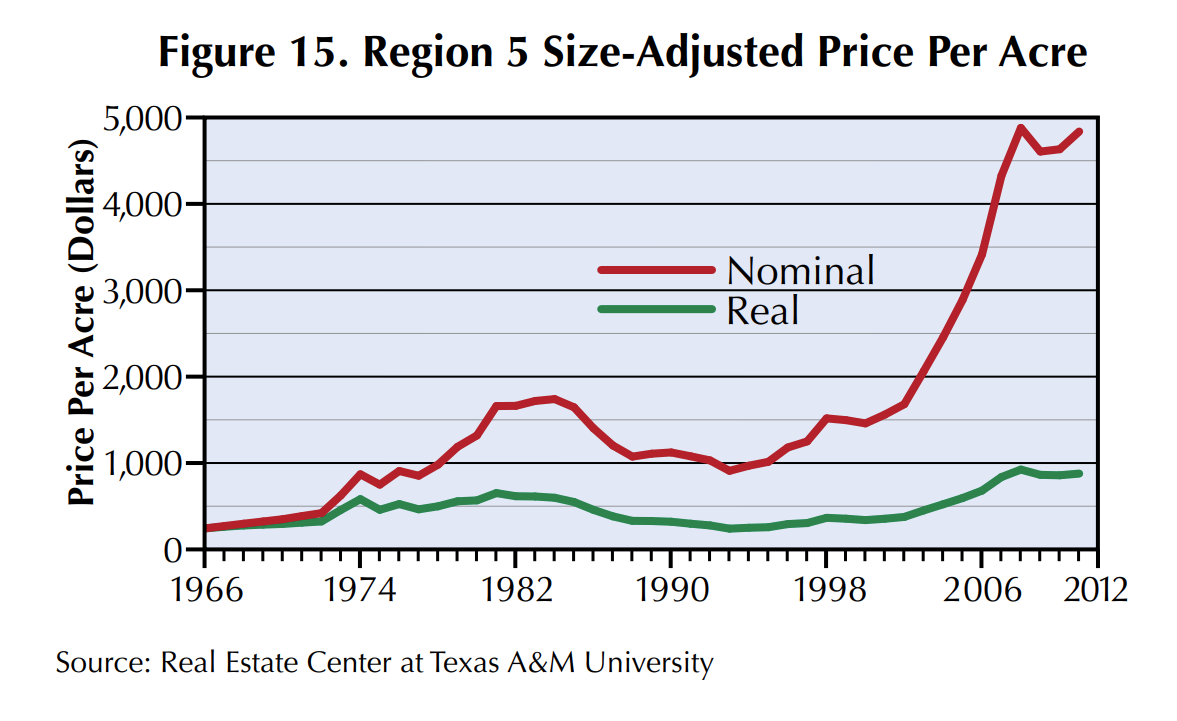
The strong energy market contributed to growing incomes, supporting demand, especially adjacent to Houston, the dominant economic engine. Still, the market managed only a 4 percent increase to $4,837 per acre and a muted sales volume of 781 for the year (Figure 15, Table 6). Sales concentrated on small properties, registering a median size of 33 acres. The past three years have recorded similar size and volume trends.
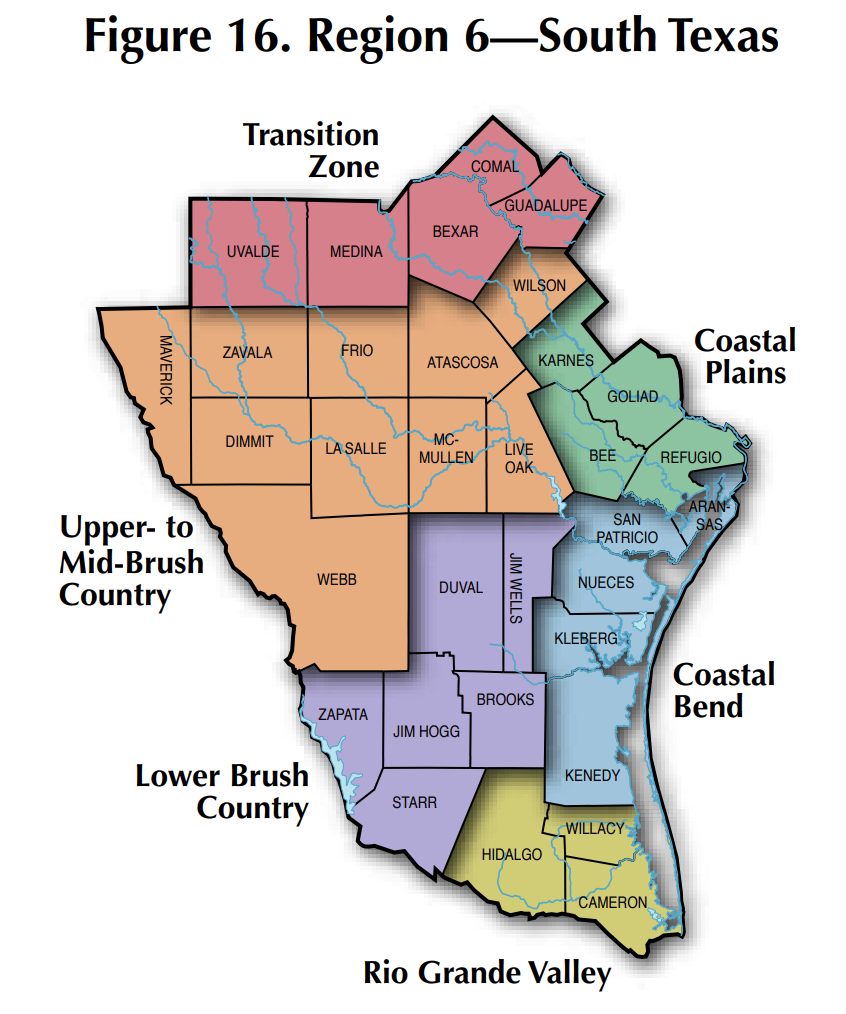
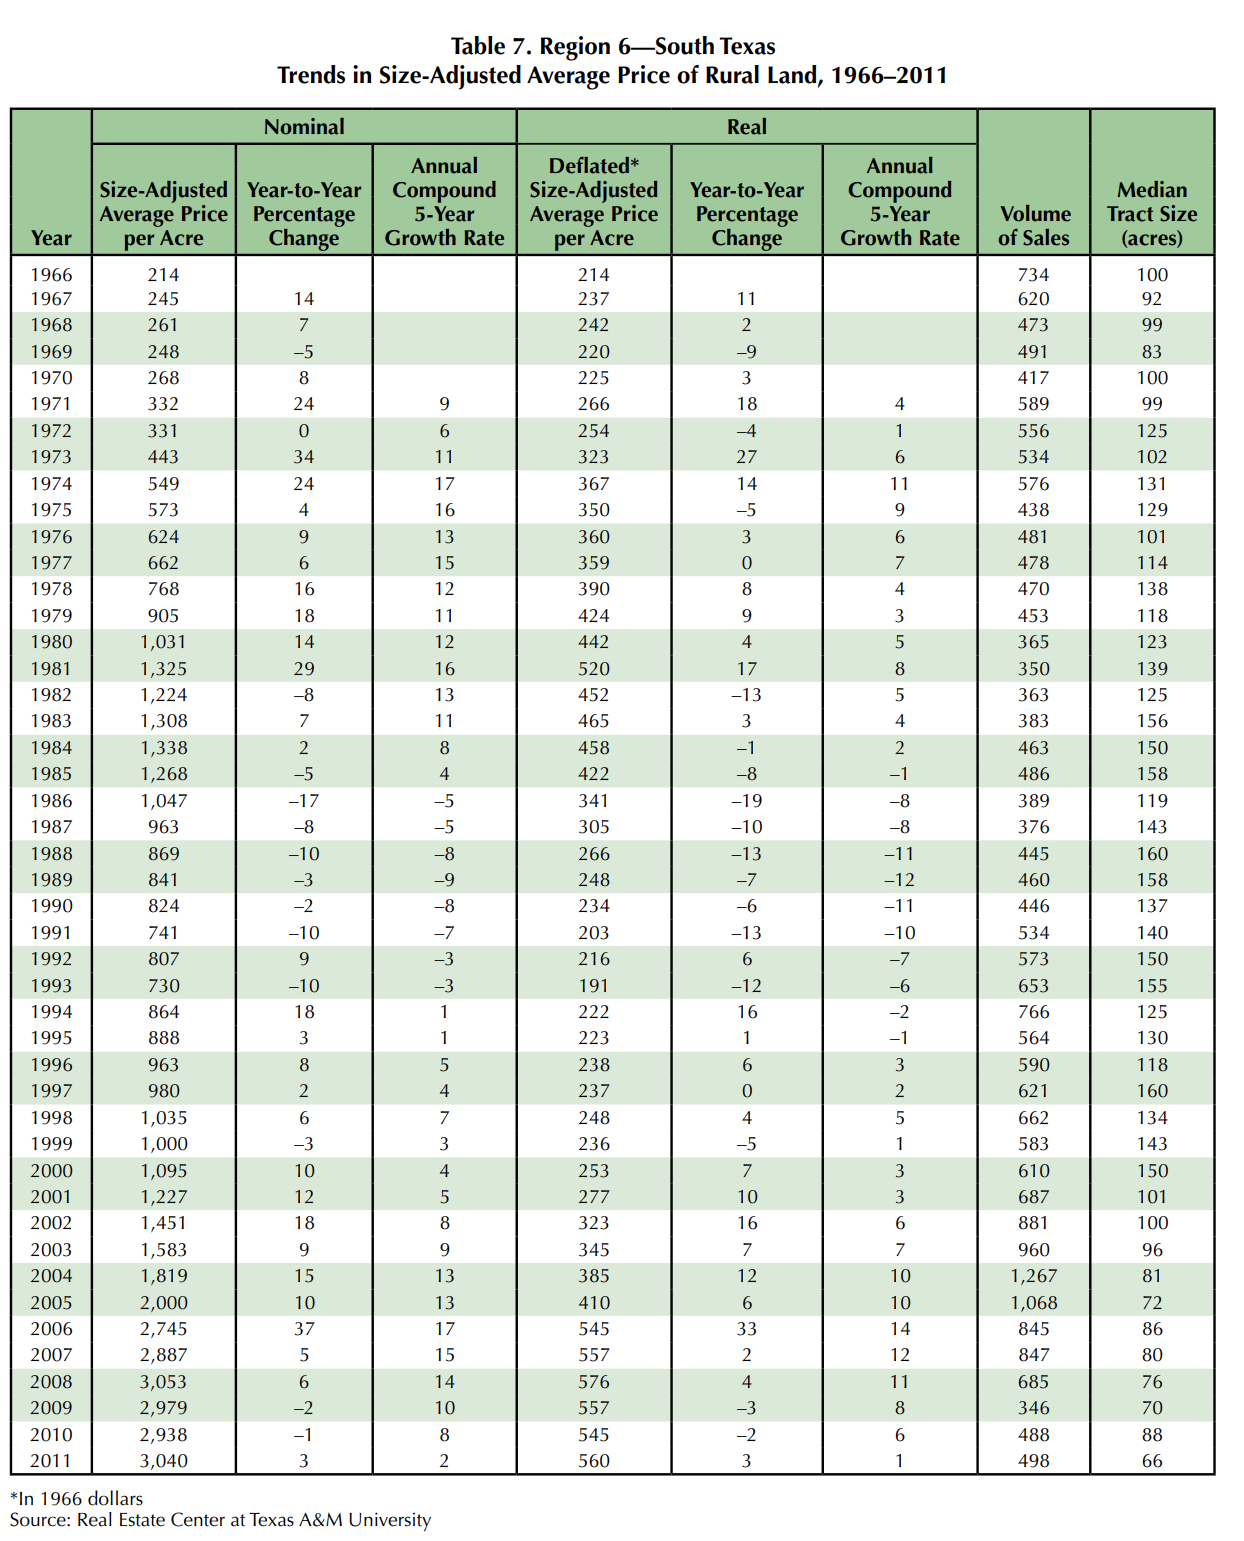
Region 6 — South Texas
This region is composed of the fringe of the Edwards Plateau, South Texas brush country, the coastal plains and Lower Rio Grande Valley (Figure 16). It encompasses large areas of sparsely populated ranches as well as large metropolitan areas.
Well known for an abundance of superior quality wildlife, ranchers and recreational users keep nearly 68 percent of its acreage in native rangeland. Sizable expanses of cropland make up about 20 percent of acreage, evenly split between irrigated and dryland cropland.
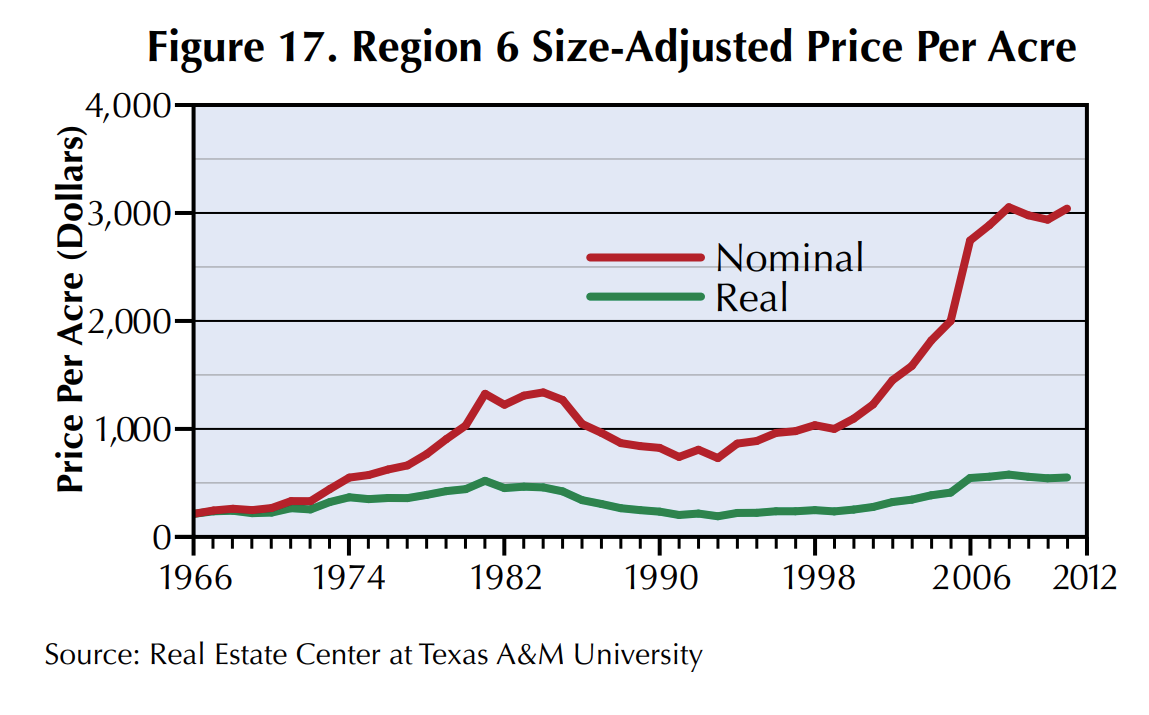
Markets in this region began to slow early in the recession. At $3,040 per acre, real prices were about the same as in 2007 (Figure 17, Table 7). Sales volume dropped in the past three years. With 498 sales posted in 2011, the volume of activity matched 1990-era markets. Development of the Eagle Ford Share oil and gas play promises to permanently change this area. The influx of people and capital will likely impact land markets for years to come.
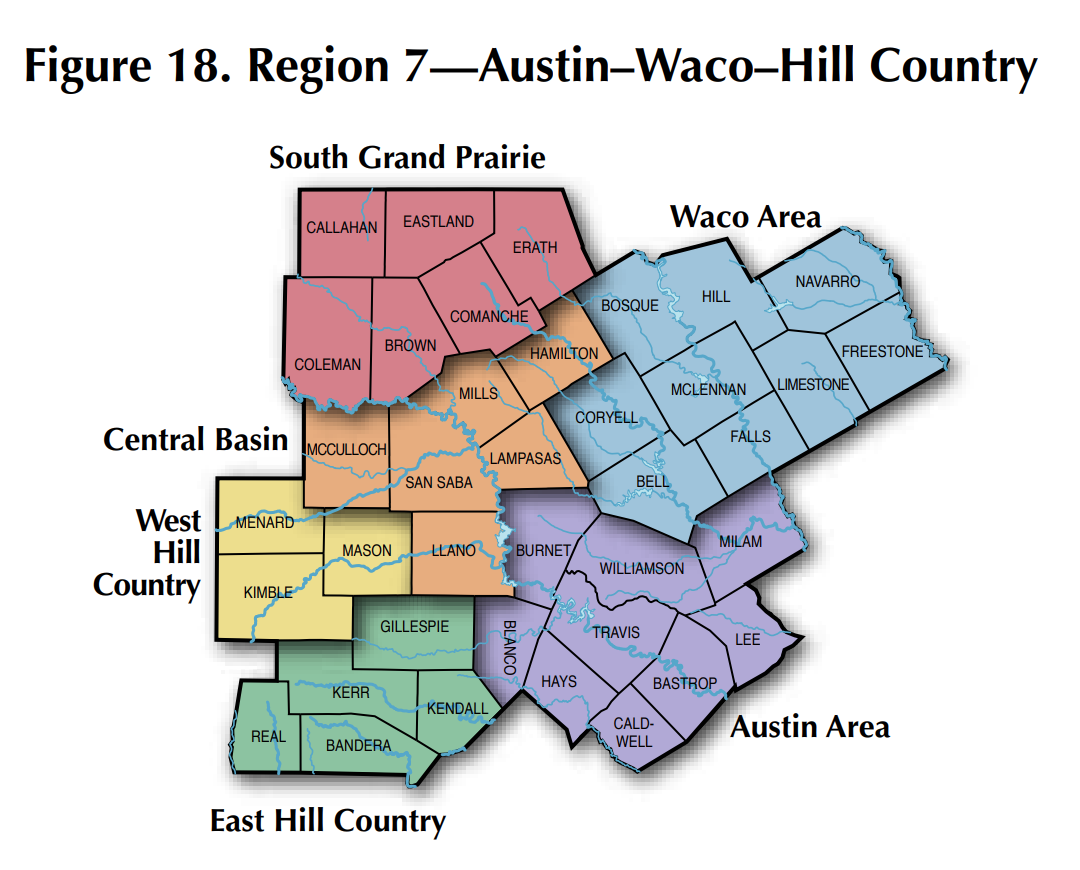
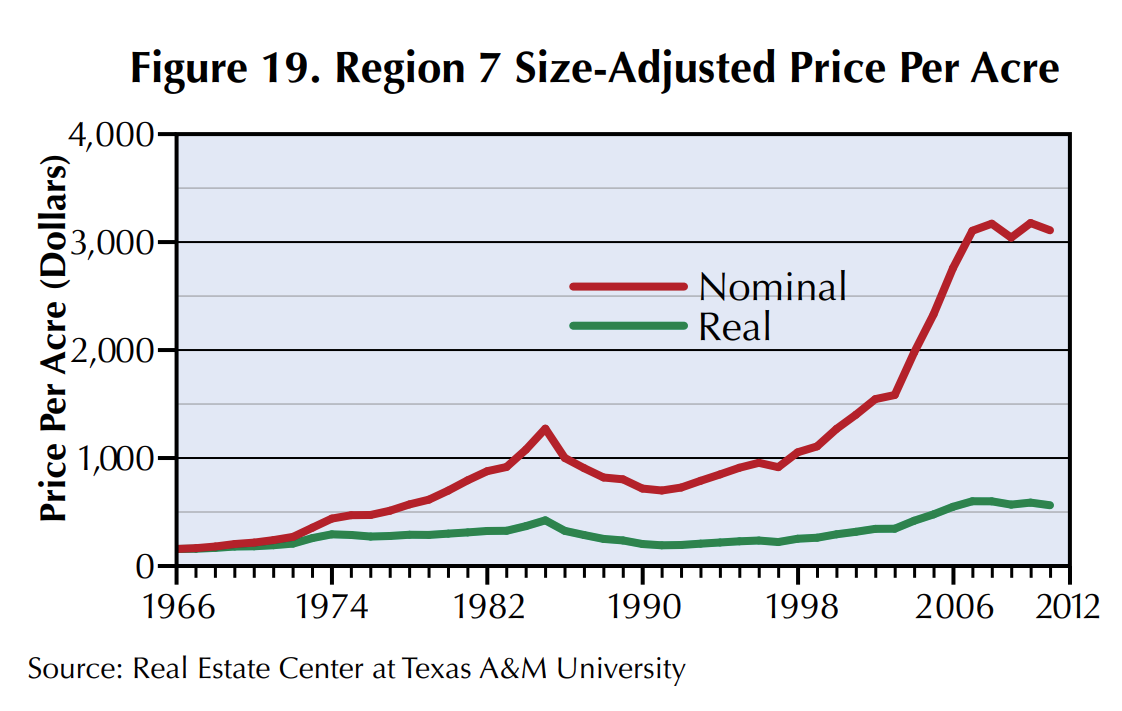
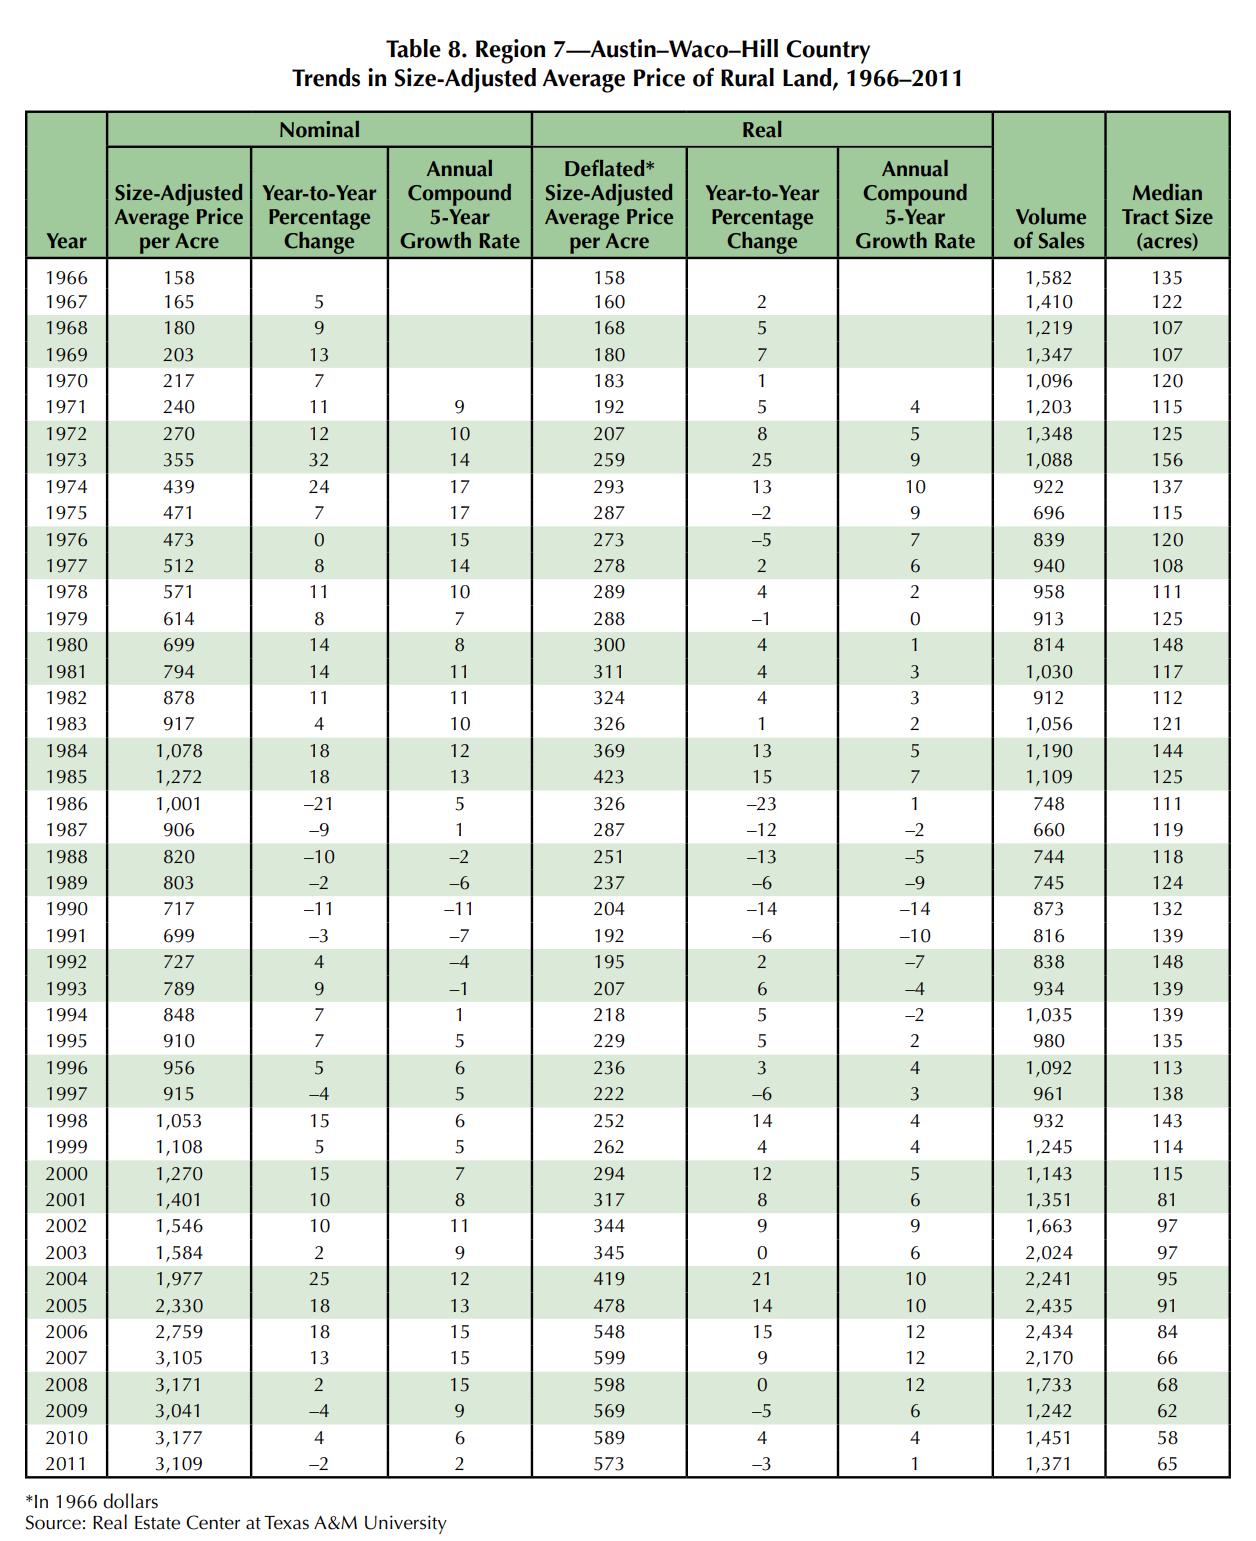
Region 7 — Austin-Waco-Hill Country
Land use in this region (Figure 18) is dominated by grazing, which accounts for more than 82 percent of acreage. Prices have been stagnant since 2007 with a low of $3,041 per acre in 2009 and the 2011 price at $3,109 per acre (Figure 19, Table 8). Sales volume continued at a depressed level with 1,371 transactions recorded. The median 65 acres per transaction continued a four-year sales trend toward small properties.
You might also like


Texas Land Market Developments — First Half 2007
Sales volume dropped 31 percent in the first half of 2007, but prices rose 15 percent. The average property sold averaged 82 acres, a new low. There was a continuing interest in land as an investment. Some buyers immediately put purchased property back on the market.


