


Texas Rural Land Markets | Second Quarter 2024
The Texas Rural Land Markets report contains an analysis of Texas land markets. The reported sales consist of a sample of verified transactions through second quarter 2024.

About this Report
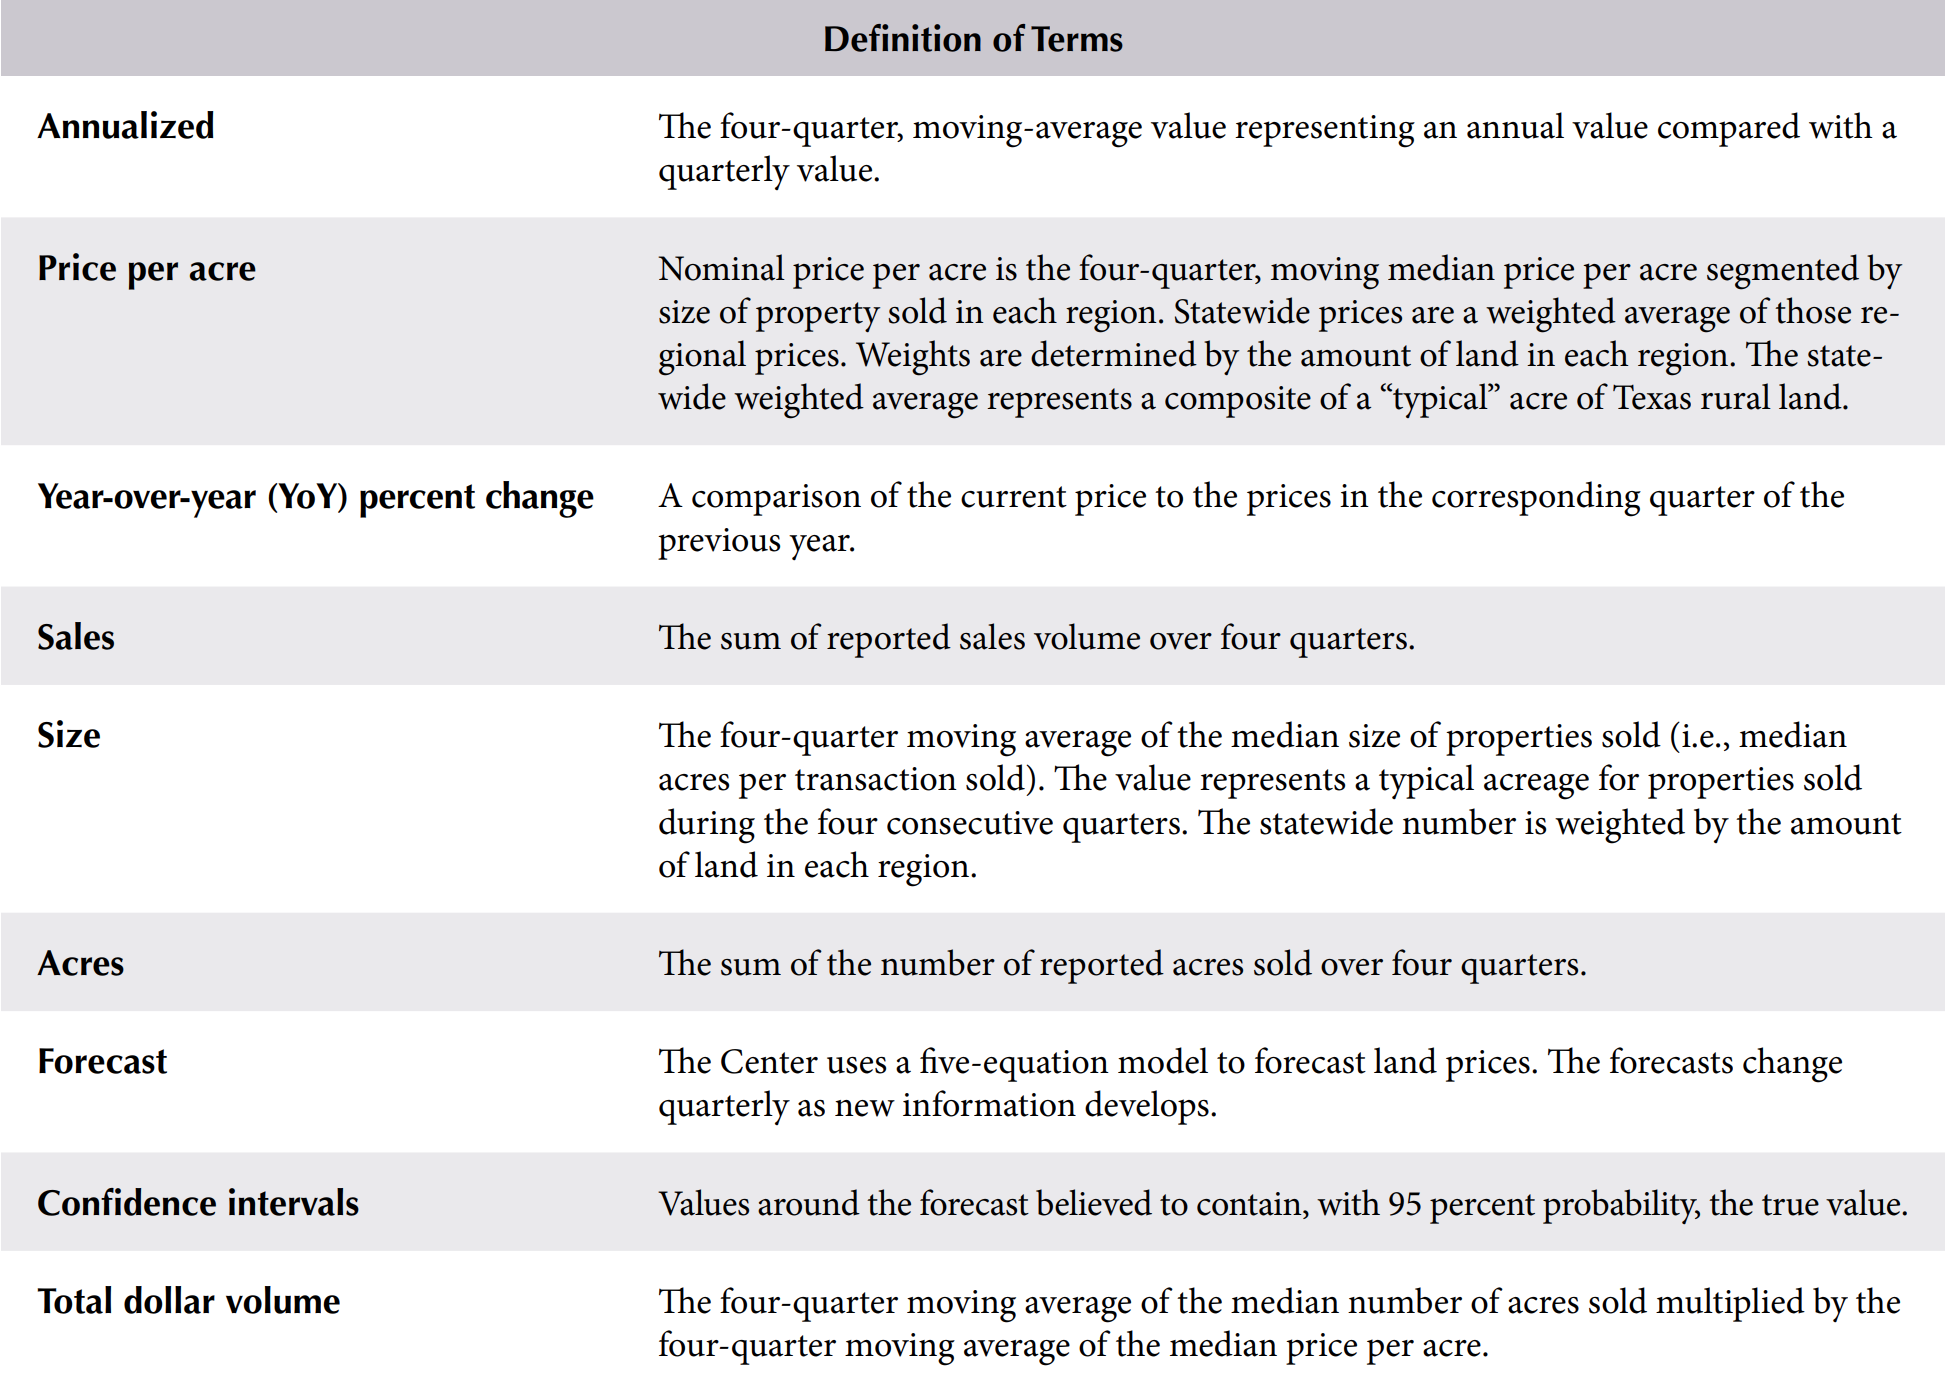
The Texas Land Market Latest Developments report contains an analysis of Texas land markets. The reported sales consist of a sample of verified transactions through first quarter 2024. The report does not include all Texas land sales. The statistics reflect a mixture of land uses and conditions and represent the market for large rural land tracts (the minimum land size is region-specific due to the varied tract sizes sold in each region). Statistics in the report reflect general trends without regard to land use or type. The analysis reports quarterly, annualized changes using moving averages as they generally minimize noisy, short-term fluctuations and provide a long-term indication of market trends. Reported values are based on median prices because they are the most stable representation of market conditions.
Users should regard the statistics presented here as indicators of past market conditions providing a general guide to land market trends. The reported data do not represent prices or values of any particular farm or ranch. Users should not consider the reported statistics as a substitute for an appraisal or market study of current local sales regarding the value of any particular farm or ranch.
For historical data on Texas’ Land Market Areas and data for Louisiana, Mississippi, and Alabama, go to trerc.tamu.edu/rural-land. This page also includes a link to Texas Rural Land Value Trends, a regional analysis of Texas markets by the Texas Chapter of the American Society of Farm Managers and Rural Appraisers.
Texas
Statewide median prices continued to rise through the second quarter and increased 3.7 percent year over year (YOY) to $4,702, the first reading over $4,700. The real (deflated) price per acre rose 1.1 percent YOY. The five-year compound annual growth rate (CAGR) was nearly constant around 10.5 percent across 2023. It slipped to 10.3 percent in 1Q2024 and currently sits at 9.9 percent through 2Q2024.
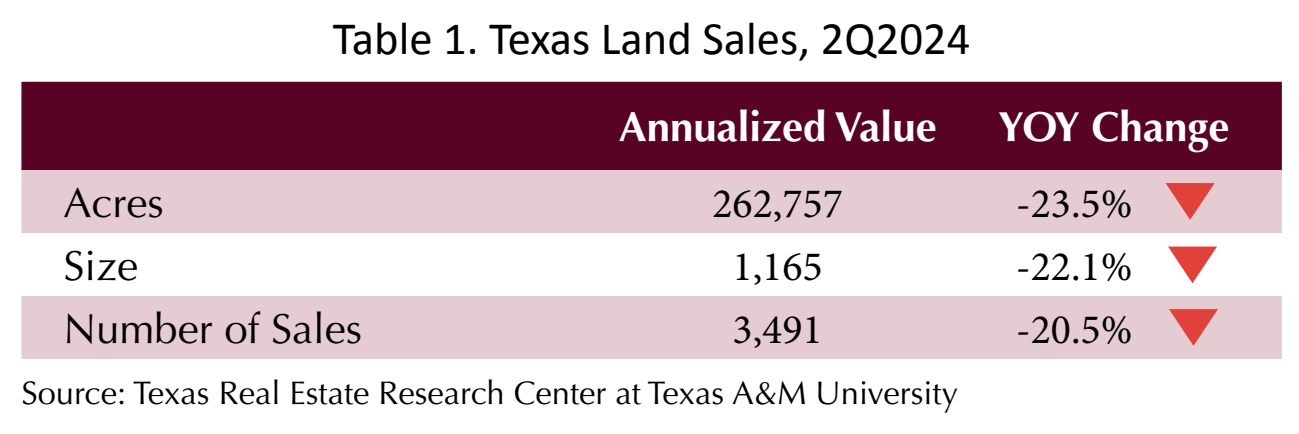
Annual sales fell 20.5 percent YOY to 3,491 in 2Q2024. The percentage drop in quarter-only sales volume was almost identical to the annualized total. The number of sales in 2Q2024 was 824, a 20.9 percent drop from 2Q2023 (1,041 sales), but the 2Q2024 number may yet be revised higher. The continued cooldown in sales is obvious, albeit at a more modest pace than last year.
The typical size retracted from the same quarter a year ago, down by 22.1 percent to 1,165 acres. This was down slightly from last quarter’s typical size of 1,186. Region 2 (Far West Texas), where size was down 26.4 percent, had a large impact on this number; though it accounts for a tiny proportion of the sales, it covers a large proportion of the state’s land mass. Size was up in three regions (1,3, and 5).
Total acres sold statewide was down 23.5 percent at 262,757 acres. Every region saw a decline in total acres sold, but the decline in Region 3 was only 2.9 percent. Statewide total dollar volume, at $1.24 billion, declined by 20.7 percent over the prior annualized total. While changes over 20 percent are quite large, the YOY decline is much less drastic than what was seen from the end of 2021 through 2023.
The rate of price increase has slowed to below 4 percent in each of the last two quarters but has also held above 3 percent. While in the first quarter prices were down in four of the seven regions, this quarter prices were down in only two regions (3 and 5). These results show market activity is still below normal levels, but prices continue to show modest gains. It will be interesting to see if these prices hold up next quarter, as a continuation in low market activity is expected.
Comparing sales of 2Q2023 to 2Q2024 across the 33 Land Market Areas (LMAs), there was an even more mixed picture of gains and losses in prices statewide with the quarterly median flat YOY. There were 15 LMAs with negative price changes and 16 with positive. Only two of the negative price changes and one of the positive indicated a statistically verifiable trend. The mixture of positive and negative results with few statistically significant shifts suggests a market searching for a sustainable price trend. The typical size as an average of the LMAs was up 7 percent YOY to 127 acres.
| Texas Statewide | |
| Price per acre | $4,702 |
| YOY change | 3.71% |
| Size (acres) | 1,165 |
| YOY change | -22.11% |
| Number of sales | 3,491 |
| YOY change | -20.49% |
| Dollar volume | $1,235,482,816 |
| YOY change | -20.65% |
| Total acres sold | 262,757 |
| Acres change | -23.49% |
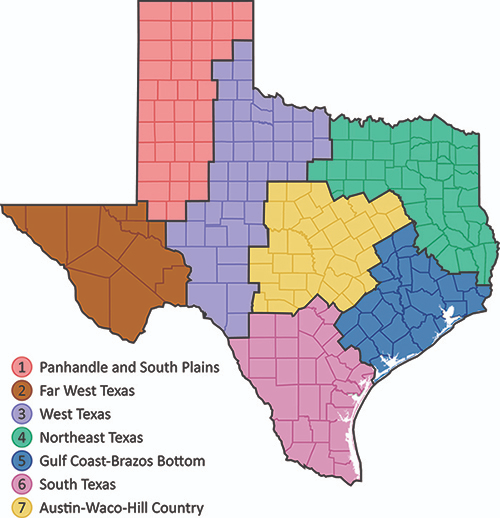
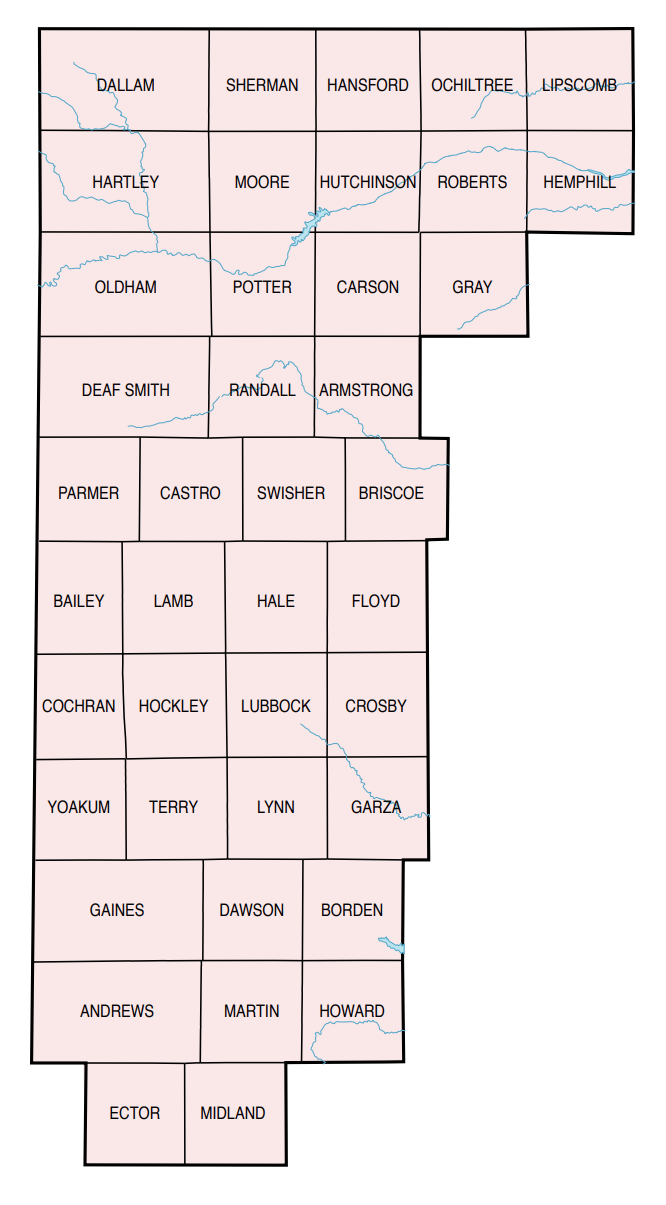
Region 1 : Panhandle–South Plains
After last quarter’s annualized gain of 1.2 percent, Region 1’s price gained 4.7 percent to $1,710 per acre. The price in this region has been at or near $1,700 per acre since third quarter 2023. The annualized number of sales dropped 24.6 percent to 315 transactions. A 34 percent decline in total acres sold contributed to a 30.9 percent decrease in total dollar volume to $79.4 million. Size increased slightly by 5.4 percent YOY to 379 acres. The continued decline in sales volume illustrates softened demand compared to a year ago. Furthermore, the quarter-only sales volume was on par with fourth quarter 2019. However, 1982 was the last year with a second-quarter number this low.

| Panhandle–South Plains | |
| Price per acre | $1,710 |
| YOY change | 4.65% |
| Size (acres) | 379 |
| YOY change | 5.44% |
| Number of sales | 315 |
| YOY change | -24.64% |
| Dollar volume | $79,401,469 |
| YOY change | -30.90% |
| Total acres sold | 46,434 |
| Acres change | -33.97% |
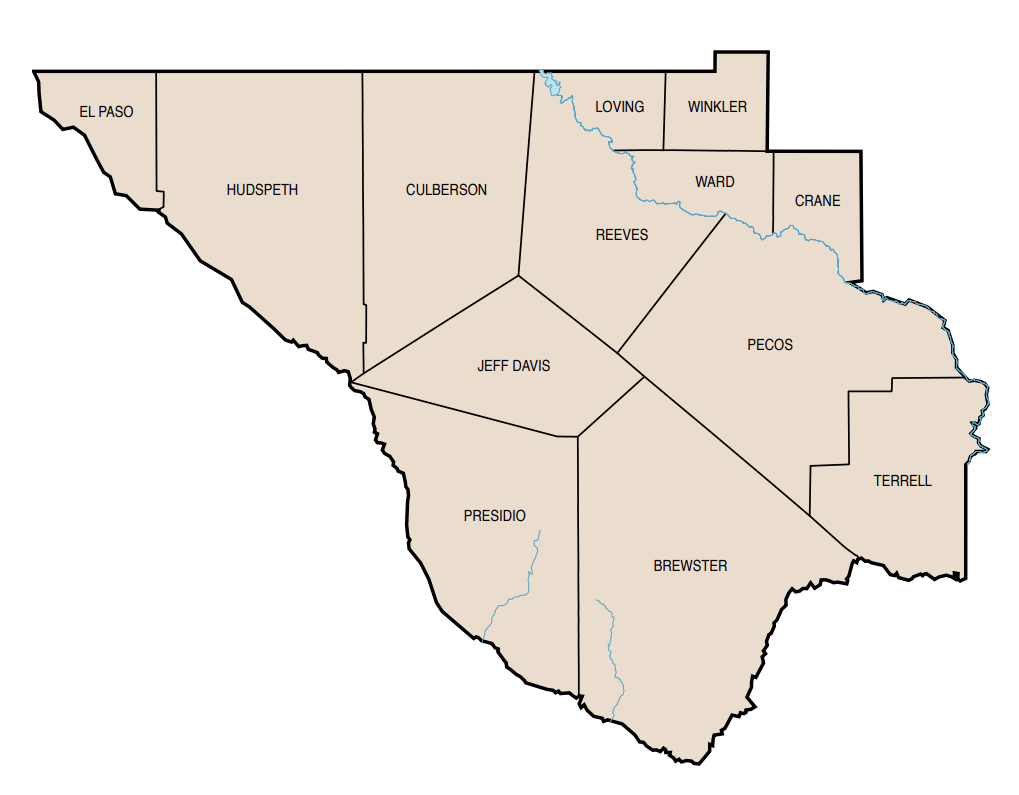
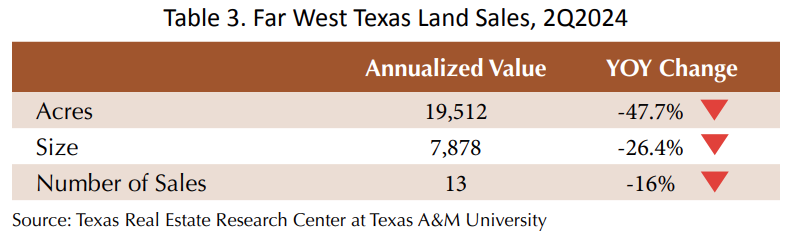
Region 2 : Far West Texas
Demand for land in this region remains weak. Sales activity was almost nonexistent again in the second quarter, with annualized sales volume down 16 percent from an already low level. However, the latest price rose by 20.8 percent YOY to $593 per acre, down slightly from 1Q2024. Total dollar volume dropped by 36.8 percent to $11.57 million. Size declined 26.4 percent to 7,878 acres. Total acres declined 47.7 percent to 19,512 acres. Lack of a sufficient volume of transactions makes it difficult to accurately estimate trends in this region.
| Far West Texas | |
| Price per acre | $593 |
| YOY change | 20.77% |
| Size (acres) | 7,878 |
| YOY change | -26.44% |
| Number of sales | 13 |
| YOY change | -15.97% |
| Dollar volume | $11,570,816 |
| YOY change | -36.84% |
| Total acres sold | 19,512 |
| Acres change | -47.70% |
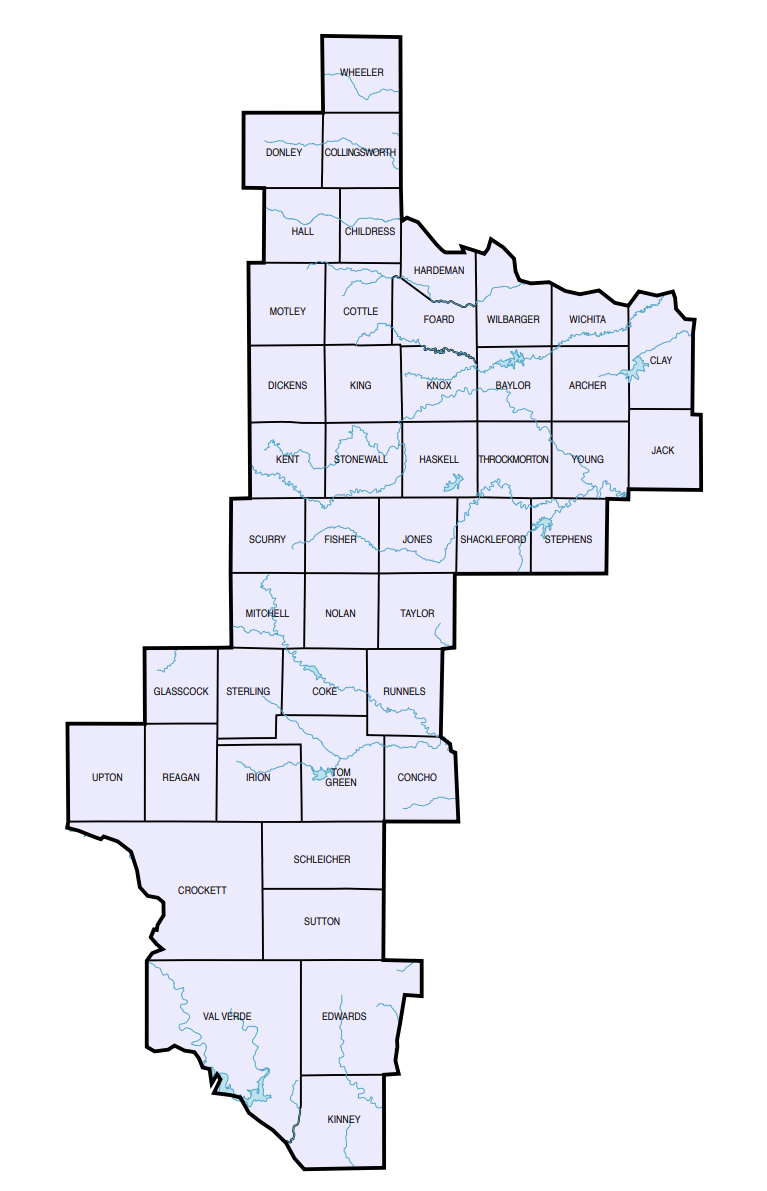
Region 3 : West Texas
Median price in this region continued to decline last quarter, down 6 percent to $2,284 per acre. Prices remain soft in the Edwards Plateau – West (LMA 9, down 10 percent YOY), while rising slightly in the North Central Plains (LMA 12, up 6 percent). Tract size rose to levels common in 2021 and 2022, coming in at 420 acres this quarter, 4.6 percent larger than one year ago. Annualized sales volume declined 17.7 percent to 456 sales with second-quarter-only sales well below 2Q2023. Total dollar volume at $178.08 million decreased by just 8.7 percent. At 77,967 acres, total acreage declined 2.9 percent YOY.

| West Texas | |
| Price per acre | $2,284 |
| YOY change | -6.01% |
| Size (acres) | 420 |
| YOY change | 4.65% |
| Number of sales | 456 |
| YOY change | -17.69% |
| Dollar volume | $178,075,665 |
| YOY change | -8.73% |
| Total acres sold | 77,967 |
| Acres change | -2.90% |
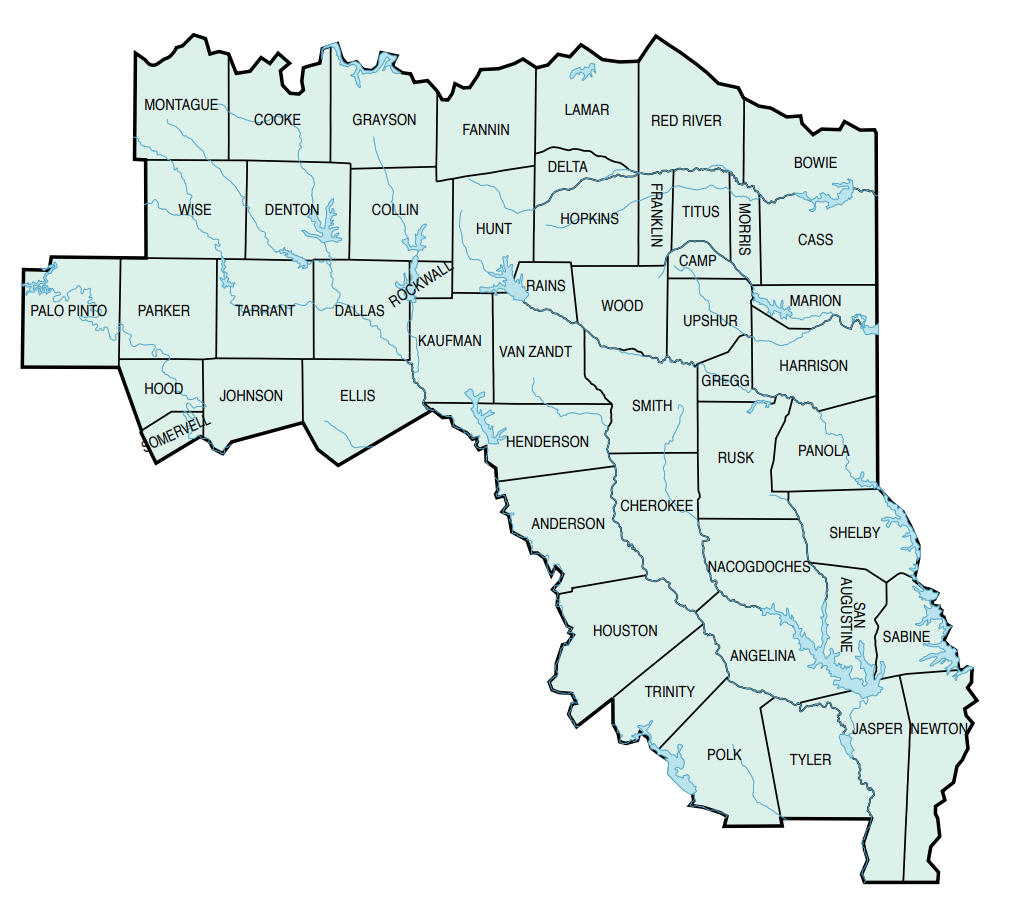
Region 4 : Northeast Texas
Demand for high quality tracts in this market continued to push up prices YOY, though just below the high reached in the first quarter. Also, the price previously reported for the first quarter ($8,427 per acre) has been revised to $8,279 (a gain of 8.3 percent, rather than 10.2 percent). Current data put the price at $8,200 per acre, which is up 6.7 percent YOY. However, sales volumes continued to sink. This quarter, sales declined 26.5 percent YOY to 973, the lowest level since 2013. Total dollar volume dropped 27.9 percent to $244.05 million. The size of the typical transaction decreased slightly to 110 acres, down 6.3 percent. Total acreage contracted 32.4 percent, falling to 29,762 acres.
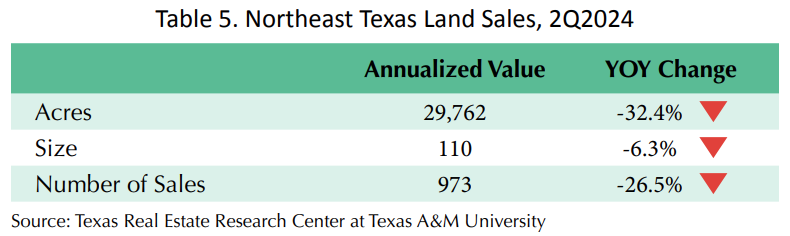
| Northeast Texas | |
| Price per acre | $8,200 |
| YOY change | 6.70% |
| Size (acres) | 110 |
| YOY change | -6.33% |
| Number of sales | 973 |
| YOY change | -26.46% |
| Dollar volume | $244,047,616 |
| YOY change | -27.87% |
| Total acres sold | 29,762 |
| Acres change | -32.40% |
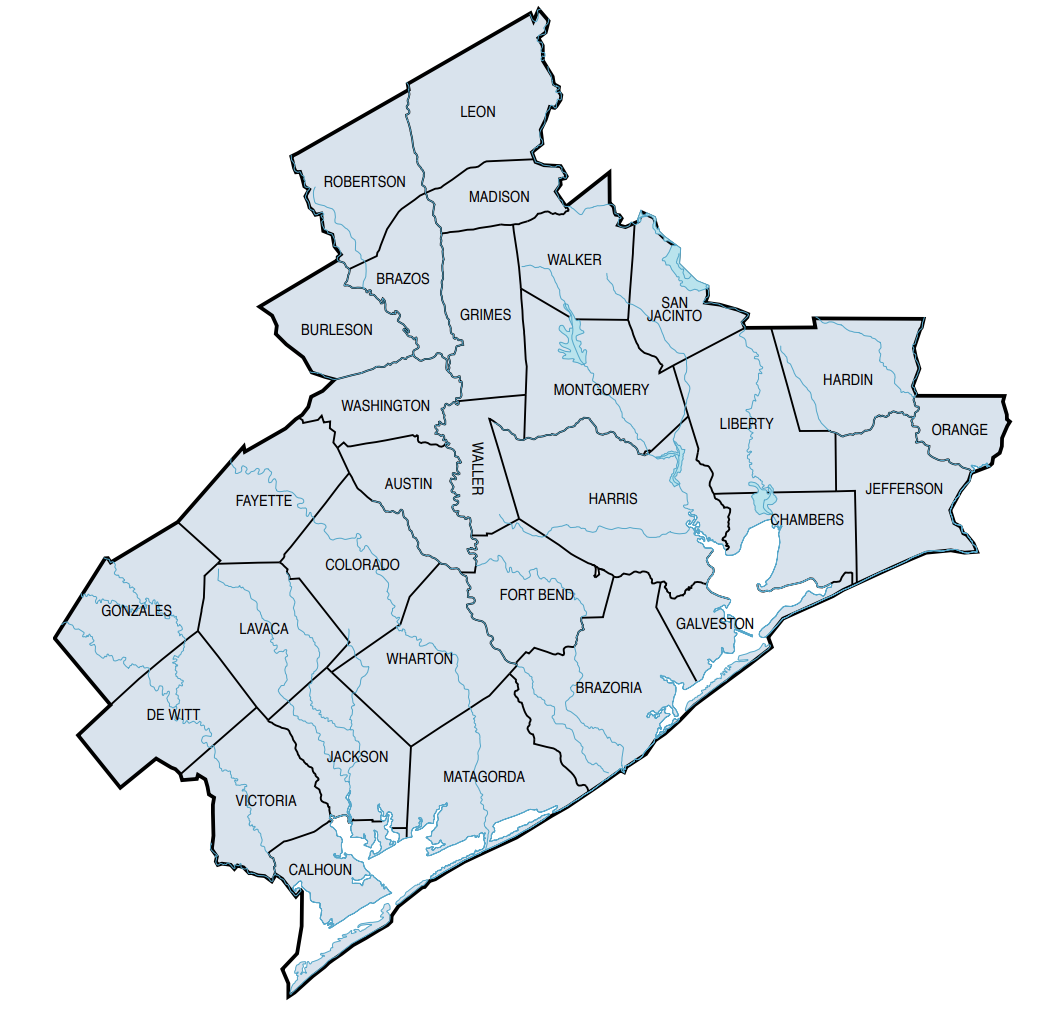
Region 5 : Gulf Coast-Brazos Bottom
The number of sales in this region fell 13.8 percent YOY to 487, and second-quarter-only sales were nearly identical to 2Q2023. At the current rate, by next quarter the four-quarter total will likely be higher than the prior four-quarter total. The price dropped 2.1 percent YOY to $9,436 per acre, but that is above last quarter’s price of $9,220 per acre. The typical size expanded by 5.7 percent to 146 acres. Total dollar volume decreased 16.5 percent to $177.87 million as total acres sold receded 14.7 percent to 18,850 acres.
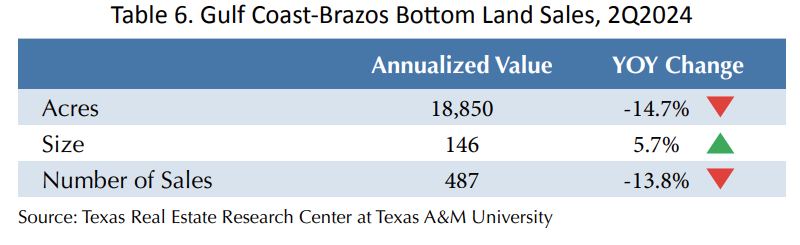
| Gulf Coast–Brazos Bottom | |
| Price per acre | $9,436 |
| YOY change | -2.08% |
| Size (acres) | 146 |
| YOY change | 5.72% |
| Number of sales | 487 |
| YOY change | -13.81% |
| Dollar volume | $177,867,956 |
| YOY change | -16.51% |
| Total acres sold | 18,850 |
| Acres change | -14.74% |
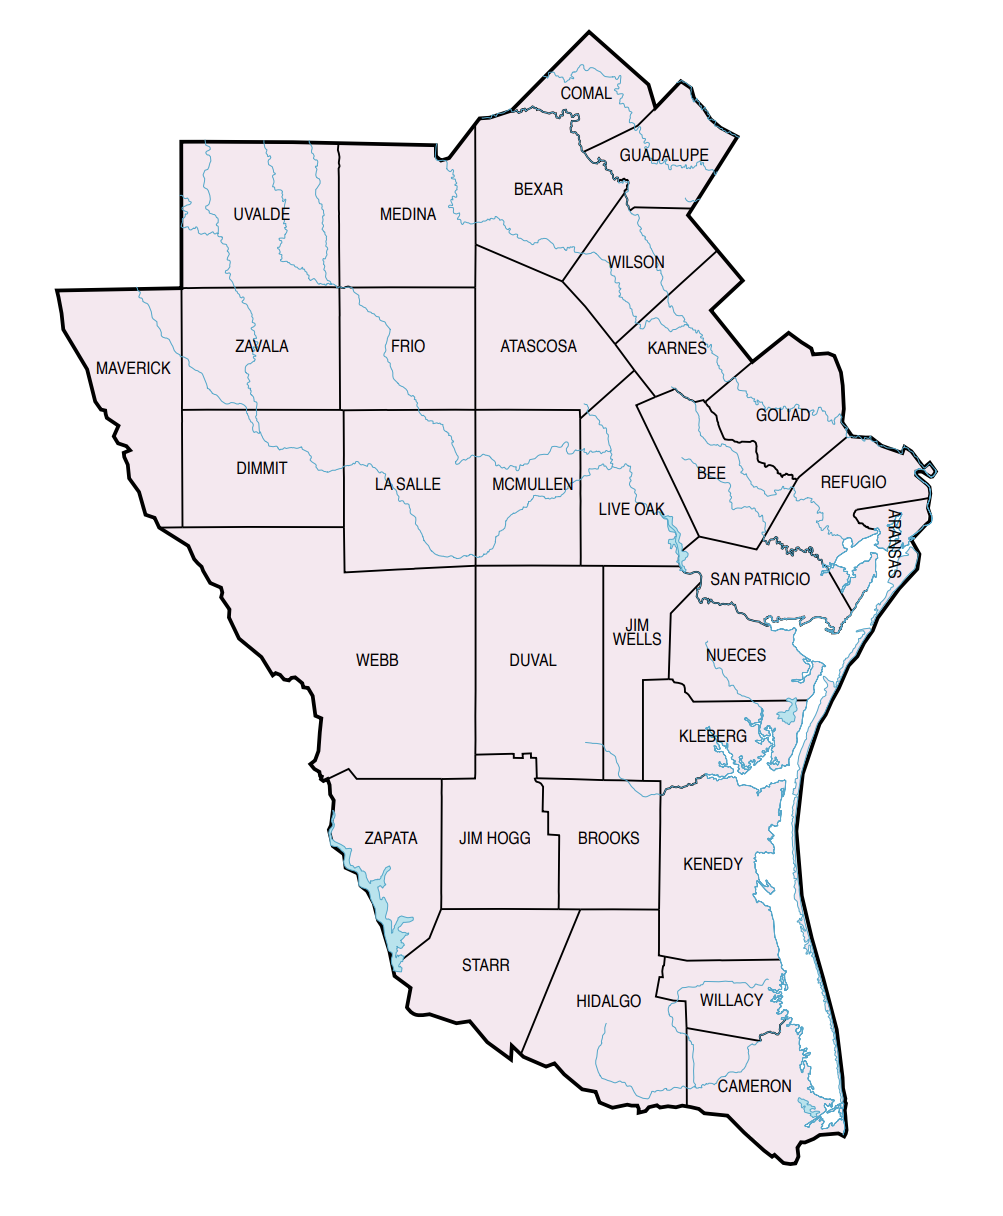
Region 6 : South Texas
South Texas market prices rose 7.7 percent, settling at $6,218 per acre. Meanwhile, the number of sales dropped 28 percent to 303, a slight improvement from the last two quarters. Typical size declined to 269, down 11.8 percent. Despite the price gain, total dollar volume dropped 33.1 percent to $144.75 million as total acres retreated 37.9 percent to 23,279 acres, which is higher than last quarter’s total. Second quarter-only sales volume was higher than the same quarter last year. Last quarter, TRERC analysis suggested this region was at or very near a trough in sales volume. So far that appears to be correct.
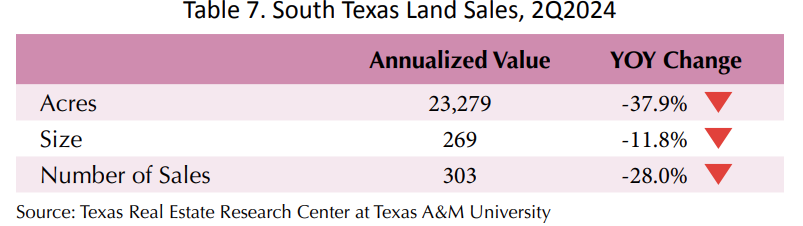
| South Texas | |
| Price per acre | $6,218 |
| YOY change | 7.69% |
| Size (acres) | 269 |
| YOY change | -11.78% |
| Number of sales | 303 |
| YOY change | -28.03% |
| Dollar volume | $144,750,224 |
| YOY change | -33.13% |
| Total acres sold | 23,279 |
| Acres change | -37.90% |
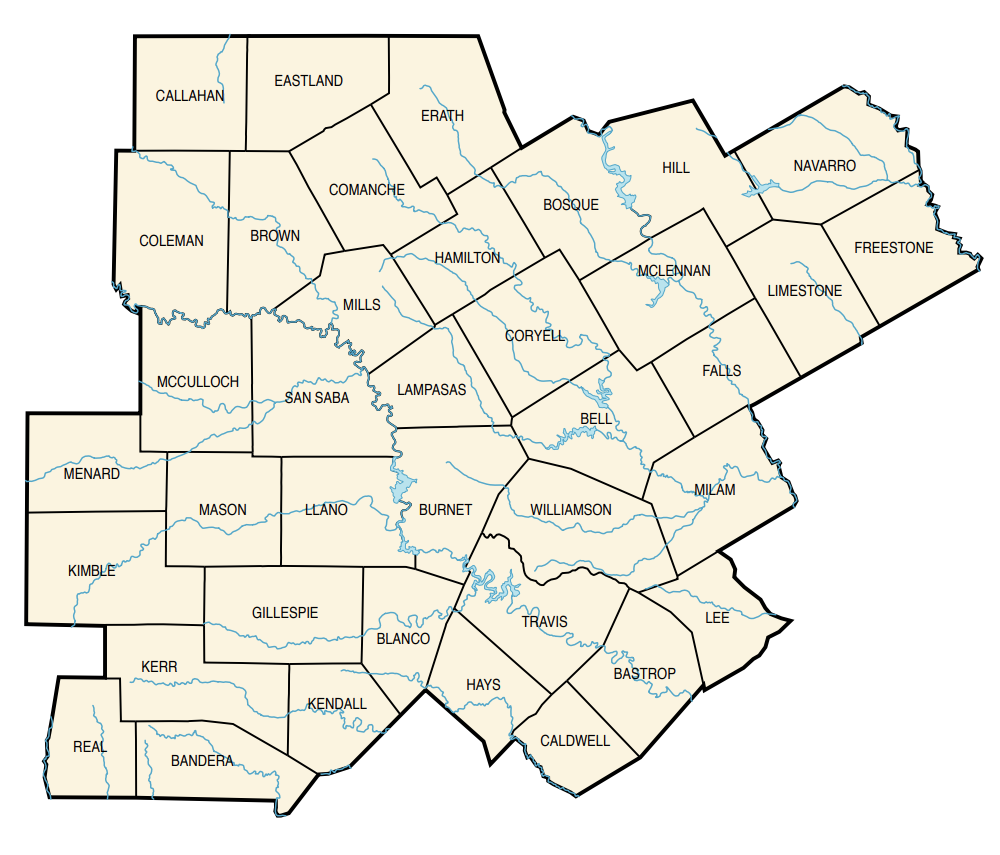
Region 7 : Austin–Waco–Hill Country
The median price rose 5.7 percent to $7,476 per acre in Region 7. This is a strong rebound after two consecutive slightly negative quarters. The number of sales declined 13.1 percent to 944. Total dollar volume declined merely 4.3 percent to $351.02 million. Size of transaction was down by 5.9 percent to 199 acres. Total acres sold dropped 9.5 percent to 46,953 acres. It appears that market activity is on the rebound from the low point seen in 4Q2023.

| Austin–Waco–Hill Country | |
| Price per acre | $7,476 |
| YOY change | 5.73% |
| Size (acres) | 199 |
| YOY change | -5.87% |
| Number of sales | 944 |
| YOY change | -13.71% |
| Dollar volume | $351,022,783 |
| YOY change | -4.29% |
| Total acres sold | 46,953 |
| Acres change | -9.47% |
Summary and Outlook
Regional prices were higher YOY in four out of seven regions and essentially flat in one of the other three. Additionally, volume (total acres sold) was up YOY in four regions. Nonetheless, Regions 1 and 4 simultaneously experienced strong median price gains and the largest declines in total acres sold. This is indicative of a market in which quality tracts are selling at higher prices while less attractive tracts are sitting on the market longer. These price and volume dynamics indicate an unsettled market through the third quarter. Consistent feedback from market participants indicates the following commonality: many sellers are expecting prices that would indicate a rate of appreciation that no longer exists, at least not broadly, and this has likely depressed sales volume. Likewise, with the low volume of total sales, current market prices appear to be propped up by a relatively small number of well-off buyers securing premium properties.
Combining the metrics with recent anecdotal evidence from market participants, it seems the rural land markets may be at an inflection point. Overall, rural land markets have stabilized such that the magnitude of YOY changes has moderated from the drastic levels of change seen in 2023 and the first quarter of this year. The last three years have been a wild ride for rural land market participants, but the wild swings appear to be over.
TRERC’s Texas rural land forecast is still predicting small declines in statewide price beginning in the next quarter or two, and a slight increase in the volume of acres sold beginning early next year. For this to happen, seller sentiment will need to change. In other words, it is likely that sellers will reduce their price expectations, attracting new buyers who may also be encouraged by lower interest rates. Additionally, many would-be buyers, fearful of the election and its potential aftermath, held off purchases. Those buyers may now be prepared to act.
It will be interesting to see the effect coming changes in federal economic policies (regulations, taxation, and government spending) will have on overall economic activity and the posture of market participants. At the very least, the election being over removes a great deal of the kind of uncertainty that typically stifles market activity.
You might also like

Credit Availability’s Effect on Texas Rural Land Markets
Texas’ varied landscapes support diverse land uses, creating competition among potential buyers. Specifically, in growing metropolitan areas like Dallas-Fort Worth or Houston developers seeking land for urban expansion (housing, commercial, industrial) compete with buyers who have agricultural interests (farming, ranching).


TG Magazine
Check out the latest issue of our flagship publication.