The roller coaster ride of the last ten years isn’t over just yet. Before the housing market can return to normal, the large inventory of available properties needs to be sold. That could take between 1.5 and three years.
Jan 24, 2011
The Lost Decade?
The past ten years proved a heck of a ride for the housing market, and in the end, the numbers were pretty much back where they started. To crank things up again, all the available homes on the market need to … well, find homes.

For those who wish to live in “interesting times,” the past ten years have been a dream come true. The first decade of the new millennium produced the highest economic highs and the lowest economic lows the country has seen in more than 70 years. The swings were so broad that in many key aspects the decade ended about where it began. With all its trials and tribulations, this period may go down in economic history as the “Lost Decade.”
The decade may be remembered for keeping homeownership in the spotlight despite the fact that the rate of homeownership ended the decade roughly where it started.
Fortunately, most Texans weathered the decade far better than other Americans, particularly those in other high-growth states. But it was not easy.
Employment and Job Retention
Nationally, the Great Recession’s impact was most felt in employment. Between 2000 and 2009, the total number of payroll jobs declined 0.7 percent from 131.79 million to 130.92 million (Table 1). Meanwhile, the total number of private sector jobs declined 2.4 percent from 111 million to 108.37 million. Job losses in the private sector were partially offset by an 8.5 percent increase in government jobs during the decade, from 20.8 million to 22.55 million jobs.
In 2000, 136.89 million people in the United States were employed, representing 64.4 percent of the total population. This is the employment-to-population (E-P) ratio. In 2009, the E-P ratio dropped to 59.3 despite the fact that more people — 139.88 million — were employed, a declining proportion of a growing population. By September 2010, the E-P ratio stood at 58.5. The last time the E-P ratio was that low was in October 1983, when it was 58.4.
Lack of jobs and unemployment are the most serious problems facing the country today. The number of people unemployed in 2000 was 5.69 million, roughly 4 percent of the measured labor force. By 2009, that number had grown to 14.27 million, an unemployment rate of 9.3 percent. And that does not include the number of people working part time or underemployed.
Texas, by comparison, fared better in job retention and employment. Jobs continued to be created in the state through 2008 but declined in 2009. Overall, the decade saw positive growth in number of jobs and total employment. The decade started with 9.43 million jobs in Texas and increased 9.3 percent to 10.31 million by 2009. During that time, private sector jobs increased from 7.9 million to 8.5 million, a nearly 8 percent increase.
Although the total number of Texans employed climbed from 9.9 million to 11.02 million during the decade, the number unemployed doubled from 452,000 to 911,000, raising the unemployment rate from 4.4 percent to 7.6 percent. Texas was not immune to the economic ills besetting the country, and owing to a rapidly increasing population, the state’s E-P rate decreased from 47.3 percent to 44.5 percent.
Demographics
Texas was the fastest growing state in the nation based on total population increase from 2000 to 2009. The total U.S. population increased about 24.8 million or 8.8 percent, from 282.17 million to 307.01 million. Texas added nearly four million, growing from 20.95 million in 2000 to 24.78 million in 2009, an 18 percent increase (Table 1).
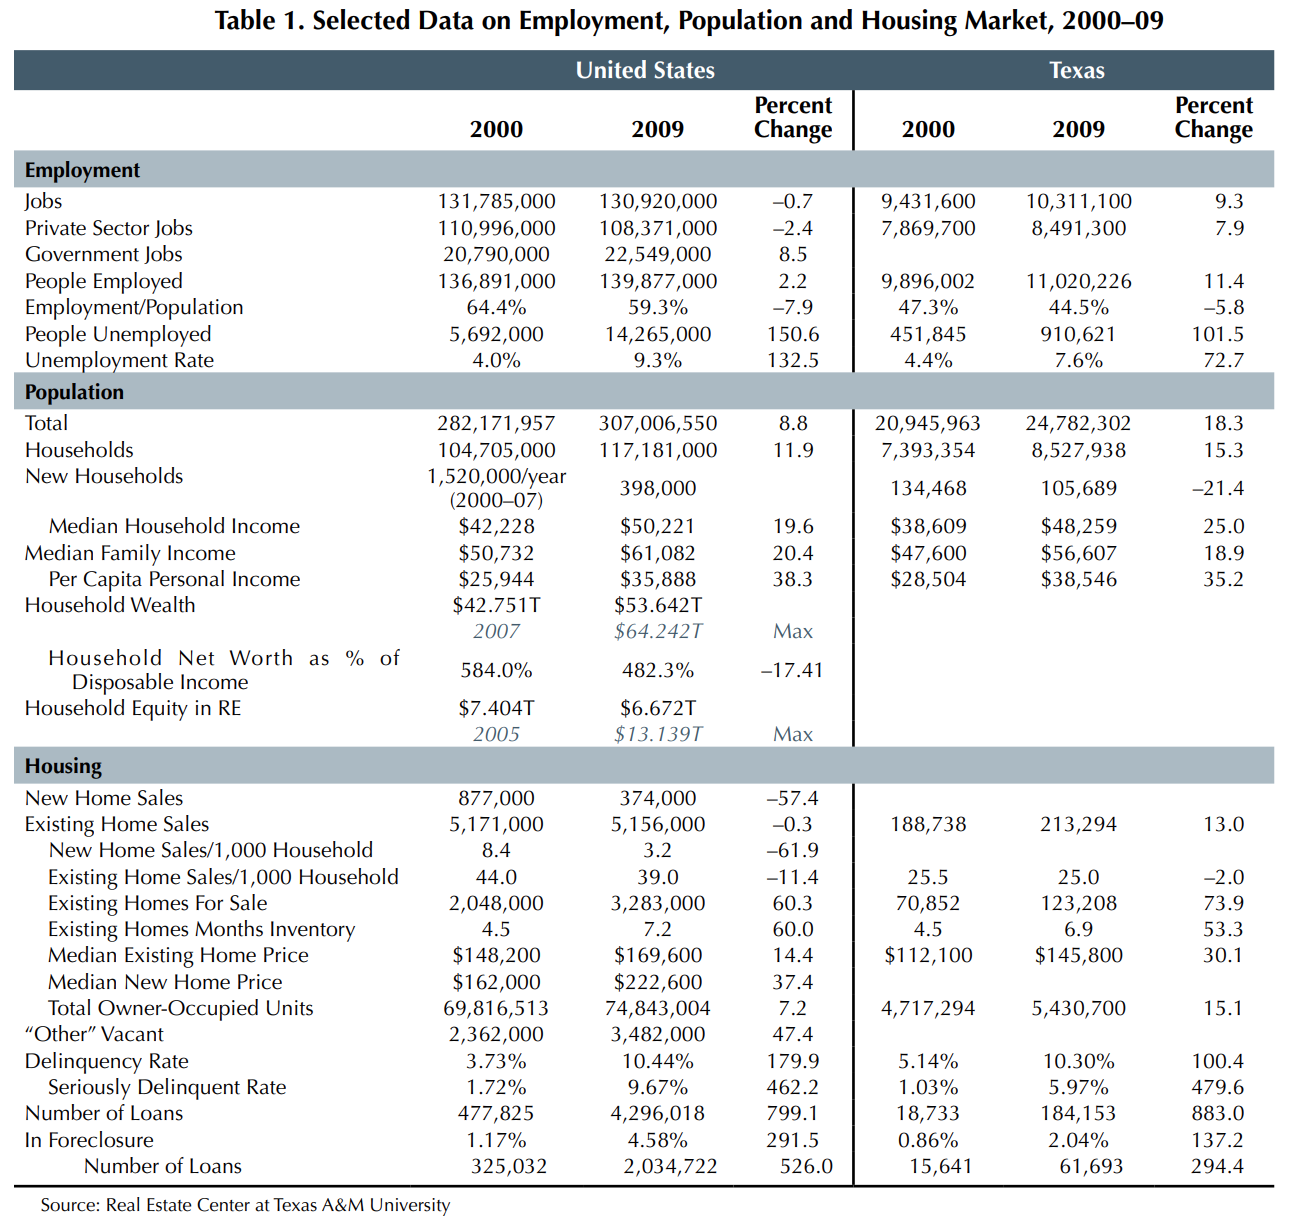
Growth in the number of households, the basic demand unit for housing, is a major factor in the housing market. Total U.S. households increased by 12.5 million or 12 percent during the decade, from 104.7 million in 2000 to 117.2 in 2009. Annual increases were erratic. New household formations averaged 1.52 million per year between 2000 and 2007, during the boom years, but reached only 772,000 in 2008 and slipped to 398,000 in 2009. The reduction was caused by young people moving back in with their parents while others were doubling- or tripling-up on housing.
Texas household formations between 2001 and 2003 fell dramatically, averaging only 80,741 per year after setting a pace of 123,290 per year during the 1990s and adding 134,468 in 2000. From 2004 to 2008, however, new household formations jumped to an average of 157,496 per year as the population expanded an average of 452,971 per year.
In 2009, only 105,689 new Texas households were created, partially accounting for the significant slowdown in the housing market. For the entire decade, Texas averaged nearly 127,000 new households and 422,500 people per year — an outstanding rate of growth.
Household and family incomes increased during the 2000s, but household net worth took a beating. U.S. median household income increased 19 percent during the decade, while Texas median household income surpassed that mark, rising nearly 25 percent.
However, household net worth shrank more than at any time since the Great Depression. The collective net worth of all U.S. households in 2000 totaled approximately $42.75 trillion. That figure jumped more than 50 percent during the economic expansion to peak at $64.24 trillion in 2007. By 2009 the net worth of all U.S. households fell to $53.64 trillion, a loss of $10.47 trillion (16.3 percent) in three years.
More than half of the loss in total net worth came from lost value in the equity of U.S. householders’ homes. Owners’ equity in real estate reported by the Federal Reserve Bank peaked in 2005 at $13.14 trillion and dropped to $6.67 trillion by 2009, a loss of $6.5 trillion or nearly 50 percent.
Home Sales and Prices
The decade may be remembered for keeping homeownership in the spotlight despite the fact that the rate of homeownership ended the decade roughly where it started. The estimated homeownership rate in first quarter 2000 was 67.1 percent; by fourth quarter 2009, it was 67.2 percent. Between those years, the rate was as high as 69.2 percent (fourth quarter 2004).
Total owner-occupied U.S. housing units increased from 69.8 million to 74.8 million, a 7.2 percent increase. In Texas, the number of owner-occupied units increased from 4.7 million units to 5.4 million, a 15.1 percent jump, more than twice the national rate.
Home sales during the 2000s experienced a wild rollercoaster ride. The market had a significant upswing in the late ’90s that carried forward for the first few years of the decade, exploded through the middle years, then dropped during the last three years.
New home sales nationally totaled 877,000 units in 2000 with 3.6 months inventory. By 2009, new home sales reached only 374,000 units, a 57 percent drop, with 7.8 months of inventory available. Existing home sales totaled 5.17 million units in 2000 with 4.5 months inventory available. In 2009, that figure equaled 5.16 million units with 7.2 months inventory available — the same level of sales but with a 60 percent increase in available inventory. At year-end 2009, nearly 3.3 million existing homes and 232,000 new homes were listed for sale.
Home sales slowed dramatically over the course of the decade. In 2000, 8.4 new home sales and 44 existing home sales occurred per 1,000 households. By 2009, those figures fell to 3.2 new home sales and 39 existing home sales. The 2009 new home sales rate was the lowest since 1963 and 59 percent below the long-term average of 7.9 sales per 1,000 households. The existing home sales rate was about the same in 2009 as in 1997 and close to the long-term average of 38.2 sales per 1,000 households. Existing home sales peaked in 2005 at 54.5 per 1,000 households, the highest level on record.
Texas home sales exhibited wide annual variance in totals, reflecting a sales volume bubble but not a price bubble. Home sales numbered 188,738 in 2000 and 213,294, about 13 percent more, in 2009. Sales reached a peak of 292,805 in 2006, more than 100,000 sales more than in 2000, but fell each year thereafter.
The Texas rate of sales exhibited the same type of variance. Year 2000 recorded 25.5 sales per 1,000 households compared with 25 in 2009. Again, 2006 registered the peak rate of 36.1 per 1,000 households, more than double the annual average rate of 17.5 between 1980 and 1999.
Nationally, the median existing home price reported in 2000 was $148,200. By 2002, the median price reached $172,800 and in 2005, it was $221,600. However, in 2009 the median existing home price fell precipitously to $169,600 (Table 1). For the decade, the median existing home price increased 14.4 percent (about 1.5 percent per year), but that figure reflected a 23.5 percent collapse from the 2005 peak.
Home price declines varied significantly from one area of the country to another, and the declines in markets that had experienced the most significant price increases were especially devastating. In these areas, foreclosures abounded, and the value of many properties sank below the mortgage amounts.
The median new home price similarly increased early in the decade, peaked in 2006 and fell dramatically by 2009. Median new home prices went from $162,000 in 2000 to $222,600 by 2009, a 37.4 percent increase but more than 9 percent below the 2006 peak of $244,700.
Texas especially stands out in terms of home price change from 2000 to 2009. Home prices in Texas rose during the first eight years of the decade but did not exhibit the same expanded price bubble experienced in other states. Median price was $112,100 in 2000, peaked in 2007 at $147,300, and ended the decade at $145,800. Overall, the median home price rose 30 percent between 2000 and 2009, about 3 percent per year, more than double the national rate of increase. During the past three years the median price has been relatively flat, slipping a total of only 1 percent.
Home foreclosures have been a primary component of the Great Recession and a major hurdle the last three years of the decade. According to the Mortgage Bankers Association, the overall mortgage delinquency rate in first quarter 2000 was 3.73 percent. By fourth quarter 2009, it had grown to 10.44 percent, a 180 percent increase.
The rate of seriously delinquent mortgages (90+ days past due or in the foreclosure sale process) grew from 1.72 percent to 9.67 percent during the same period, or from 477,825 mortgages to almost 4.3 million, an 800 percent increase. The number of loans in foreclosure similarly jumped from 1.17 percent of all loans or 325,032 mortgages to 4.8 percent or 2,034,722, a whopping 526 percent increase in home loan foreclosures.
Texas delinquency and foreclosure rates increased dramatically but at a substantially slower pace than the United States. The state’s delinquency rate doubled, going from 5.14 percent in first quarter 2000 to 10.3 percent in fourth quarter 2009. Properties in foreclosure increased 137 percent from 0.86 percent (15,641 properties) to 2.04 percent (61,693 properties). Texas’ foreclosure rate has consistently been less than half of the national rate.
View From Here
It is hard to tell how fast the economy will revive. In past recessions, the housing market led the economy out of its doldrums. That is unlikely this time. In fact, right now the housing market, like most industries, needs job formation to bring it out of its recessionary depths.
How long will it take to regain “normalcy?” It depends on how long it takes for the market to clear the vast inventory of properties available, so that it can reach a balance between supply and demand. There is a sizeable inventory that must clear the market (Table 2).
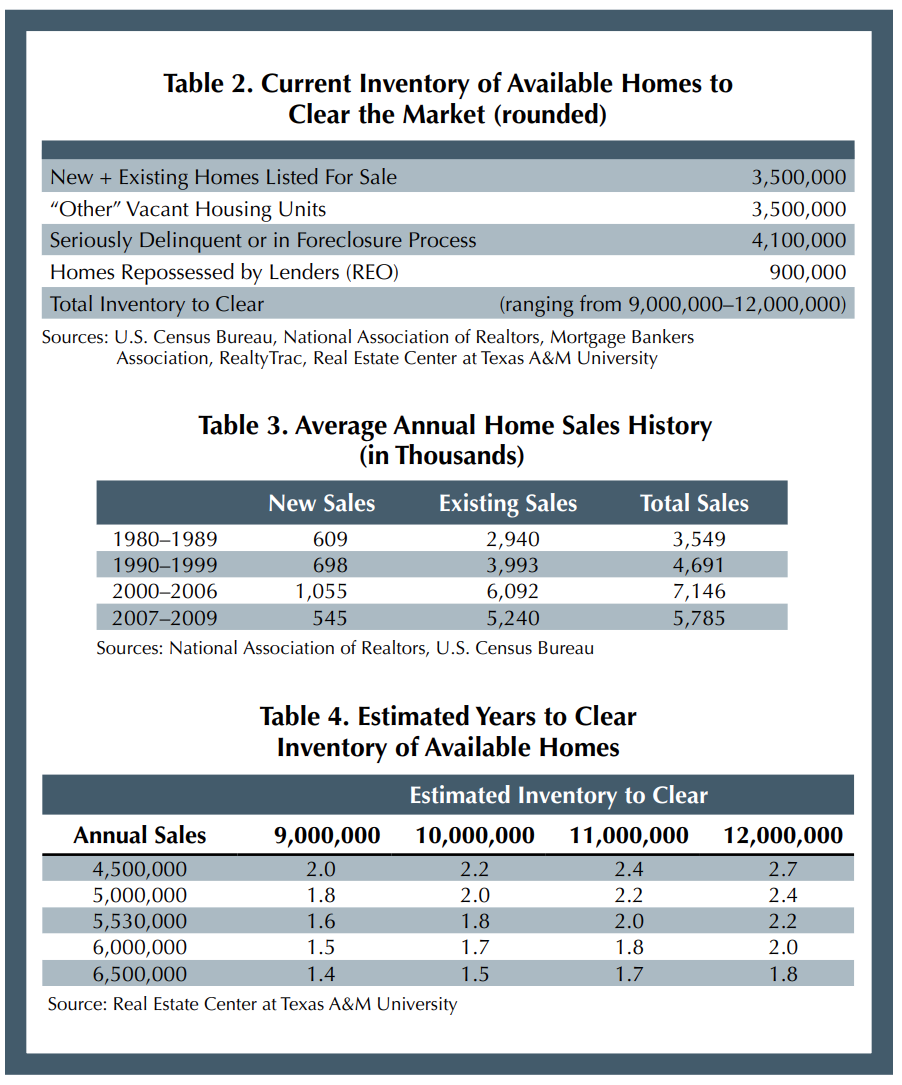
Not all of the 4.1 million mortgages seriously delinquent will end up foreclosed and available for sale, but a substantial proportion probably will. And the “other” vacant and REO properties may include some double counting. Based on different assumptions about those properties, the total inventory that needs to clear the market probably ranges from 9 million to as many as 12 million homes.
Annual home sales of new and existing houses (total demand) were relatively consistent except for the housing boom during the middle of the decade (Table 3). The time to clear the current inventory could range from 1.5 to as many as three years, depending on average annual sales during the coming years (Table 4). This would mean that the housing market probably would not recover and see substantial growth until sometime between mid-2012 and 2014.
While Texas did not entirely avoid the boom and bust cycle during the 2000s, the state’s economy and housing market did significantly better than the nation. The population continues to grow and signs of job growth are appearing. Whatever happens, Texas is poised to be one of the states leading the recovery because of its projected job and population growth and the relatively low overhang of homes to be sold.
Dr. Gaines ([email protected]) is a research economist with the Real Estate Center at Texas A&M University.
Did you like this Article?


