More Room to Work
For years, Texas has enjoyed steady job growth in economic sectors that use industrial real estate. Today’s industrial growth, however, is different.
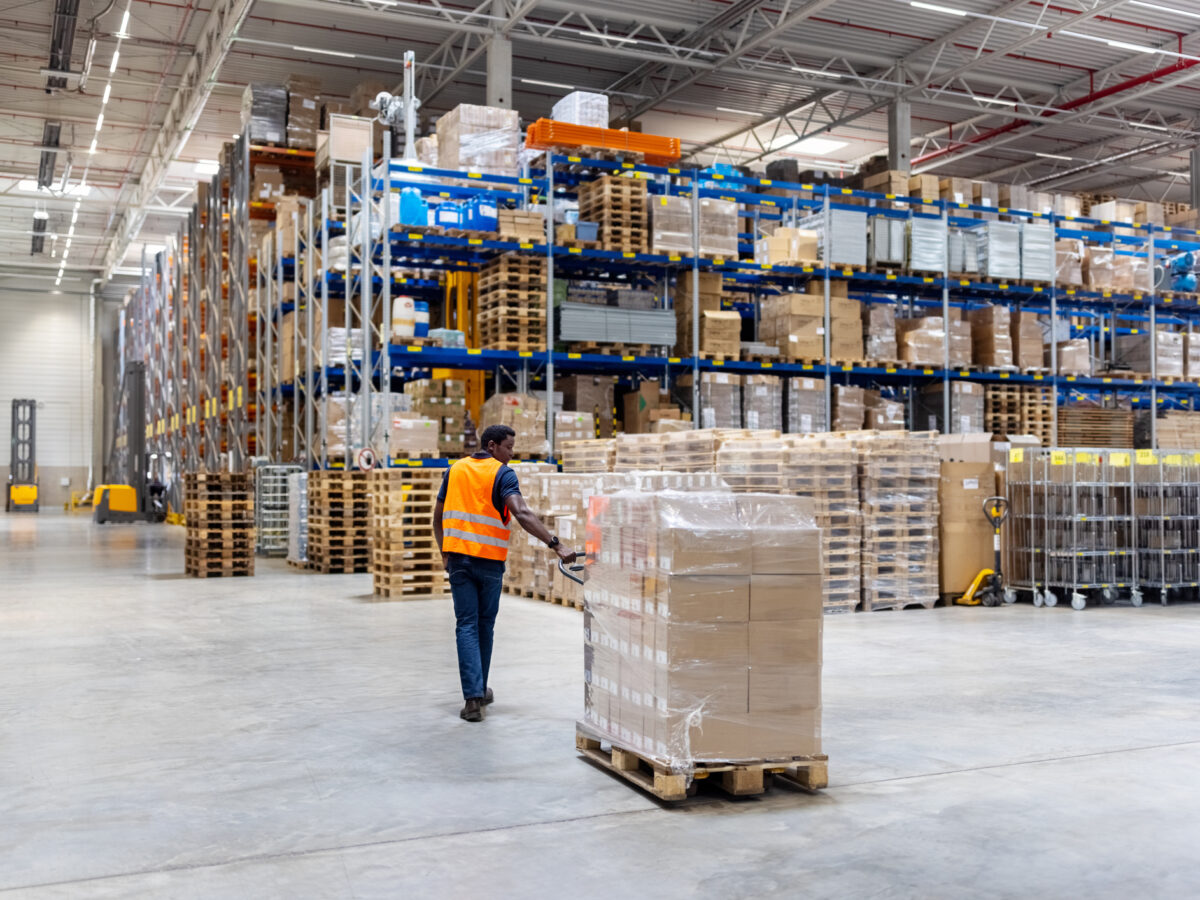
Local economic development has long relied on industrial investment. New factories and warehouses brought attainable employment and additions to the real and business personal property tax base. Indeed, annual capital investment has increased, with nationwide spending on manufacturing facilities and equipment being $85 billion higher today than five years ago.
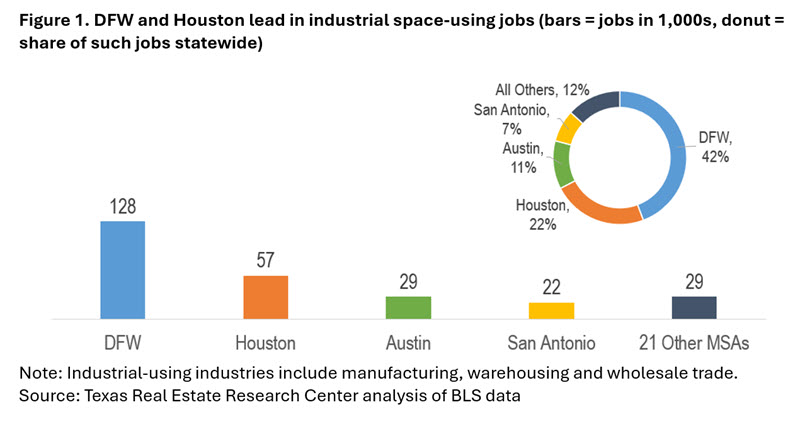
Texas has also enjoyed steady job growth in economic sectors that use industrial real estate. These are primarily manufacturing, warehousing, and the trade sectors. That growth has been concentrated in the big metro areas. Dallas-Fort Worth led the state in employment growth in industrial-using sectors (Figure 1). Since the COVID shutdowns in March of 2020, DFW has added almost 130,000 jobs, accounting for 42 percent of statewide growth in these industries. Today’s industrial growth, however, is different.
Job density in new industrial facilities is lower today than in the past. We measure this density in terms of jobs per square feet of space. Changes in technology, business processes, and household behavior are driving this trend. Prior to the COVID shutdown, we could expect to see about 560 square feet of industrial real estate delivered when Texas added one industrial-using job. In recent years the total industrial space delivered per job has increased substantially to almost 1,400 square feet.
There are two main reasons why we see more space per worker, or fewer jobs in a given square footage. First, since the shutdowns, Texas has seen a dramatic volume of large distribution centers built. These were to accommodate fast-growing e-commerce activity. Much new distribution space was by businesses of all types that wanted to increase domestic inventories to offset supply-chain problems. Second, a longer-term trend has been the increasing automation of manufacturing. This has decreased the number of workers operating a factory. Combined, these changes explain the lower job density in our recent industrial projects.
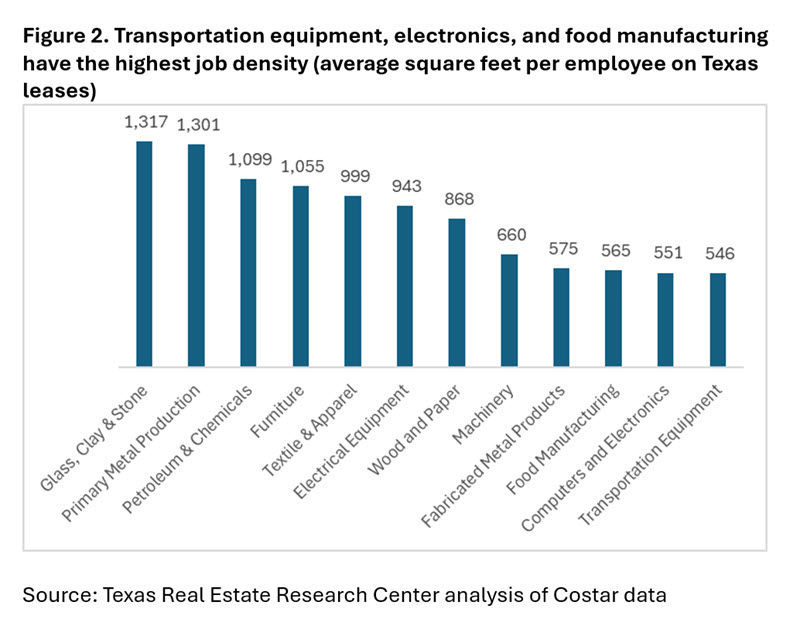
While average space per worker has increased, there are differences in job density across manufacturing and distribution subsectors. The lowest space per worker, and thus highest job density, is in transportation equipment, computers and electronics, and food manufacturing. The lowest job density is in bulk and process sectors like glass, clay, and stone; petroleum; and primary metals (e.g., smelting) (Figure 2).
Non-manufacturing distribution center job density varies by the size of the warehouse. Smaller warehouses (between 100,000 and 200,000 square feet) average about 3,000 square feet per job. The largest warehouses (those over 500,000 square feet) average 7,000 square feet of space per job. The type of distribution activity also impacts warehouse job density.
Third-party logistics services often run very low job density operations of 10,000 or even 20,000 square feet per worker. E-commerce facilities with pick-and-pack work can have higher job densities than a manufacturing operation. Such warehouses may have only 250 square feet per worker.
Economic development officials who historically rewarded job creation with their incentive tools have already recognized these trends. It is also not unusual for communities to decline proposals for large warehouses that take up valuable land and that create few jobs. Texans should expect continued success in attracting manufacturing and distribution projects. The public-private partnership models that brought to life so many major industrial projects in the past will likely change to accommodate new lower job density buildings.
Views expressed on The 338 are those of the authors and do not imply endorsement by the Texas Real Estate Research Center, Division of Research, or Texas A&M University.