Based on data through Dec. 25, 2021
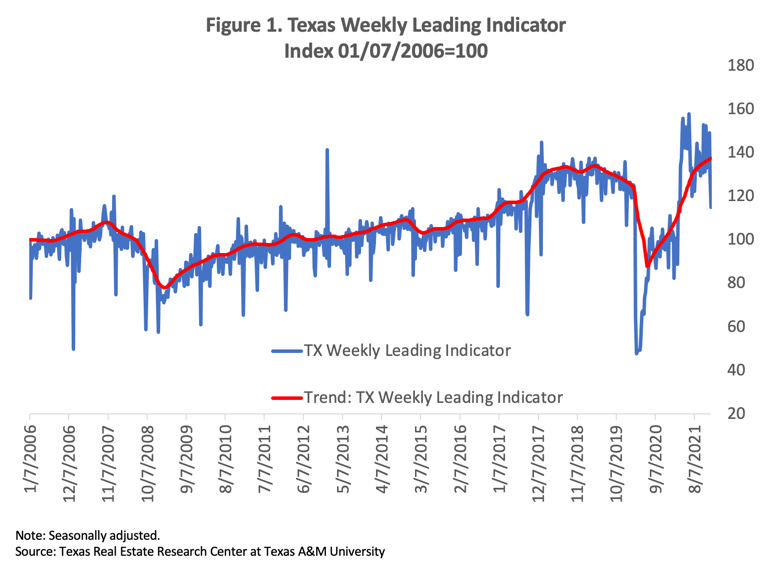
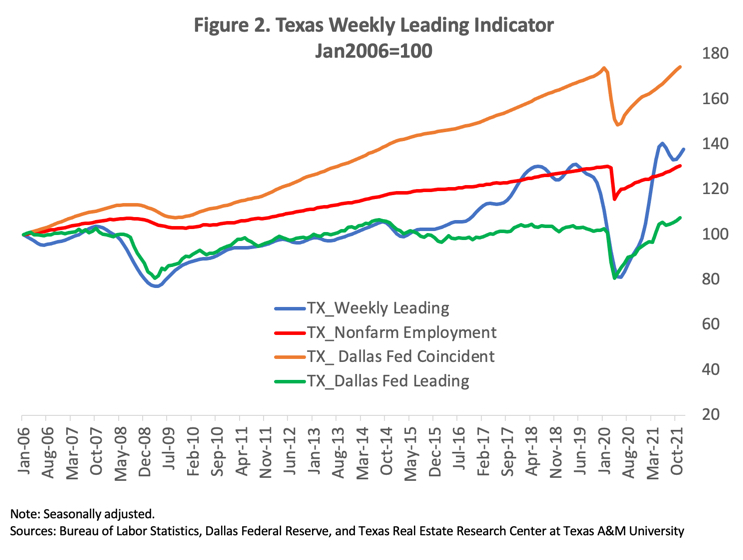
The Texas Weekly Leading Index decreased for a second straight week the week ending Dec. 25 (Figures 1 and 2). It points toward higher future economic activity as the economy continues to recover from the pandemic.
The index’s decrease was mainly due to a decrease in the number of new business applications and an increase in the number of people filing for unemployment insurance. Even though the number of new business applications fell, it remains above the historical average, signaling business activity remains strong.
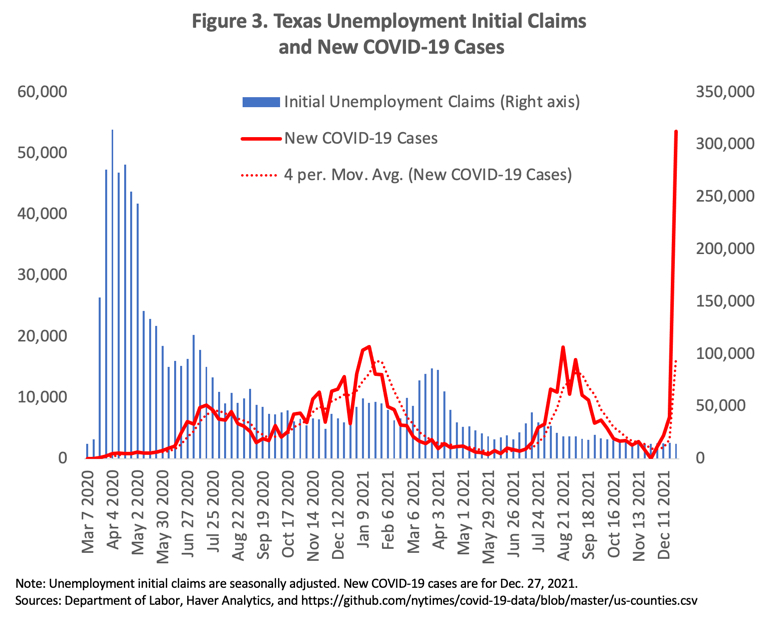
The outlook for the reopening and recovery of the state’s economy took a hit as new cases increased considerably due to an outbreak caused by the Omicron variant (Figure 3). Currently, 68.4 percent of the state’s population 12 years and older is fully vaccinated based on the most current data (Dec. 30, 2021) from the Texas Department of State Health Services.
In addition, a decrease in the real price of West Texas Intermediate (WTI) contributed to the decrease. In contrast, a decrease in the real rate for the ten-year Treasury bill (which continues to exhibit a negative return in real terms) countered the decrease in the index.
Future Texas economic growth could be hindered by possible upsurges in COVID-19 cases as economic and social activity increases. Further waves of infections can reverse increased mobility and spending, affecting the path to recovery.
About This Report
The COVID-19 health crisis is unlike any crisis the economy has experienced before. The economy is currently going through a self-induced, sudden-stop to contain and stabilize the spread of the virus and save lives. The size of the economic shock will likely result in losses that overshadow losses from the 2008-09 financial crisis.
The Texas economy is not immune to the pandemic. In fact, the state’s economy will be hit even harder than the world and the rest of the United States due to the simultaneous downturn in the oil industry.
This crisis has created a need for up-to-date economic indicators that can help forecast economic changes. The Real Estate Center at Texas A&M University has constructed a high-frequency economic activity index for Texas that estimates the timing and length of future upswings and downturns on a weekly basis.
New weekly data series (also called high-frequency data) and new methodologies to seasonally adjust the data on a weekly basis have allowed for the development of weekly coincident and leading economic indicators. The Center has a successful track record in estimating monthly residential and nonresidential construction leading indexes for Texas. Both indexes have proven useful in signaling directional changes and forecasting key indicators like single family home sales, apartment vacancy rates, and commercial vacancy rates.
The Center evaluates economic data to determine:
- economic significance,
- statistical adequacy (in describing the economic process in question),
- timing at expansion and recessions,
- conformity to historical business cycles,
- smoothness, and
- currency or timeliness (how promptly the statistics are available).
However, the indexes do have some weaknesses. Underlying indicators are subject to revision, and while errors often cancel out across indicators, revisions impact the index and future monitoring of business cycles. In addition, although leading indicators often show the direction of a business cycle, they do not measure the magnitude of the change.
Even with these caveats, leading indicators are useful for measuring business cycles. Seven variables were evaluated for this report. Four (business applications, high-propensity business applications, business applications with planned wages, and business applications from corporations) are business market variables that are tied to state business activity. One variable, weekly initial unemployment insurance claims, is tied to state employment. Another, West Texas Intermediate (WTI) real oil price deflated by the all-urban consumer price index, is related to the oil industry. The last variable, the real ten-year Treasury bill estimated using same-period inflation expectations, represents the cost of credit in the economy.
Based on statistically reliable criteria, four variables were selected as economic activity leading indicators: business applications, initial unemployment insurance claims, real WTI oil price, and real ten-year Treasury bill. These variables demonstrated a significant leading relationship with Texas nonfarm employment. All other variables were found not to be statistically valuable or to perform below the business applications variable for the leading index.
Detecting turning points in any leading index on a month-to-month basis is difficult, because not all downturn (upturn) movements point toward recessions (expansions). It’s even more difficult to do on a weekly basis. The Center has converted the weekly leading economic activity index into a monthly leading index to evaluate its predictive usefulness.
Based on the National Bureau of Economic Research methodology, Texas nonfarm employment and the Dallas Federal Reserve Texas coincident indicator are used as references of peaks and troughs to measure the state’s business cycle (see table). This makes it possible to see if the weekly economic leading indicator can predict changes in Texas business cycles.
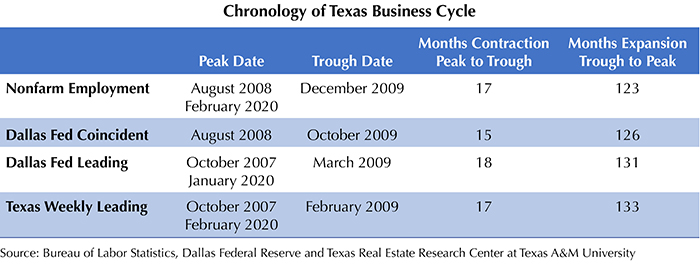
The Texas weekly leading index signaled a directional change in October 2007, 11 months before the prolonged downturn in employment that started in August 2008. Similarly, it signaled a recovery turning point in February 2009, 11 months before employment turned toward recovery in December 2009.
In addition, it predicted turning points and duration of expansion and contraction more accurately than another institution’s leading indicator–the one produced by the St. Louis Federal Reserve (Figure 4).
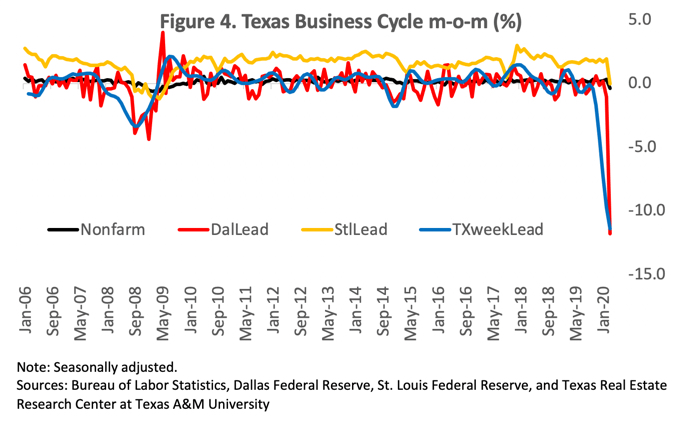
Overall, the leading index is regarded as a good indicator to predict turning points in Texas employment, even leading both the Dallas Federal Reserve’s coincident and leading indicators for the state’s economy.
One major problem in evaluating the index was the short time period. For a more accurate evaluation of business cycle relationships, it’s best to study the relationships over many business cycles. Because the predictive ability of the leading index was evaluated over a short time, it’s possible that the relationship might not hold in the future. Thus, the leading index for economic activity will be best evaluated based on its ability to lead Texas employment in the future.
_____________
Dr. Torres ([email protected]) is a research economist with the Texas Real Estate Research Center at Texas A&M University.
Previous reports available:
Based on data through:
Dec. 18, 2021
Dec. 11, 2021
Dec. 4, 2021
Nov. 27, 2021
Nov. 20, 2021
Nov. 13, 2021
Nov. 6, 2021
Oct. 30, 2021
Oct. 23, 2021
Oct. 16, 2021
Oct. 9, 2021
Oct. 2, 2021
You might also like

Publications
Receive our economic and housing reports and newsletters for free.


