


Oil and gas jobs remain the lifeblood of Midland and Odessa, attracting workers from across the state and country. Knowing about these migrants and what they do sheds light on how they’ve impacted each city’s economy and housing market.
Sep 7, 2023
Go West
The oil and gas sector has seen its ups and downs since the Great Recession. Several unforeseen events, such as an explosion in new fracking technology, Russia's war with Ukraine, and the COVID pandemic, have contributed to significant oil and natural gas price swings. Since 2011, the price of West...

The oil and gas sector has seen its ups and downs since the Great Recession. Several unforeseen events, such as an explosion in new fracking technology, Russia’s war with Ukraine, and the COVID pandemic, have contributed to significant oil and natural gas price swings.
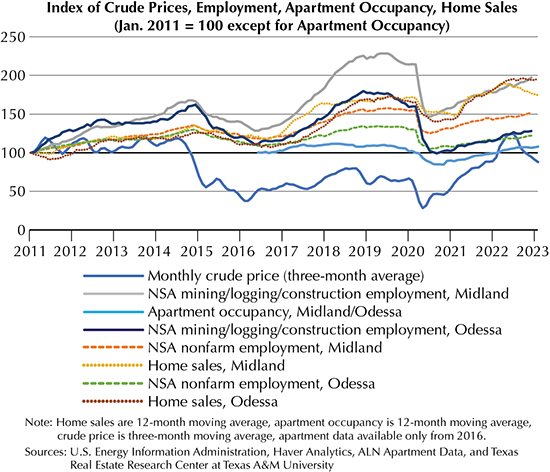
Since 2011, the price of West Texas Intermediate (WTI) crude oil has fluctuated from a high of more than $120 to a low of -$36 per barrel. The drop below zero in 2020 was the first since trading in the commodity on the New York Mercantile Exchange began in 1983. Natural gas followed suit with a Henry Hub spot price high of more than $23 and a low of $1.33 per million BTUs during the same period.
Several local and regional economies in Texas remain heavily influenced by oil and gas activity. Located in the heart of the Permian Basin, Midland and Odessa are two notable examples. The first commercial oil well was completed in the Permian in 1921, and the region remains just as important to U.S. oil and gas production today as it ever was.
It should be no surprise that oil and gas price volatility has often been accompanied by employment volatility in the Permian. Oilfield jobs are some of the few remaining that can provide an above average income for workers with varying levels of skills and education. As a result, during good times workers have been drawn to the Permian from many areas of the state and country, often from areas that don’t pay as well for a given skill or are less prosperous economically.
Although the impact may vary, employment volatility can significantly influence local housing markets. Crude price, employment, home sales, and apartment occupancy have often moved in tandem in Midland and Odessa (see figure). A deeper look into the characteristics of migrants relocating to Midland and Odessa from 2011 to 2021 provides further insight into their composition and possible influence on local housing and job markets.
Who Are the New Arrivals?
Workers, often accompanied by their families, came from a number of different states to many parts of the Permian Basin in the 11-year period being analyzed.
Although the Permian covers 17 counties in Texas as well as a large part of southeastern New Mexico, the focus here is restricted to the Midland and Odessa Metropolitan Statistical Areas (MSAs). Each MSA is composed of only one county—Midland County (Midland) and Ector County (Odessa). The data source for migrant characteristics is IPUMS USA, University of Minnesota, www.ipums.org, which collects, preserves, and harmonizes U.S. Census Bureau microdata from decennial censuses and the annual American Community Survey (ACS).
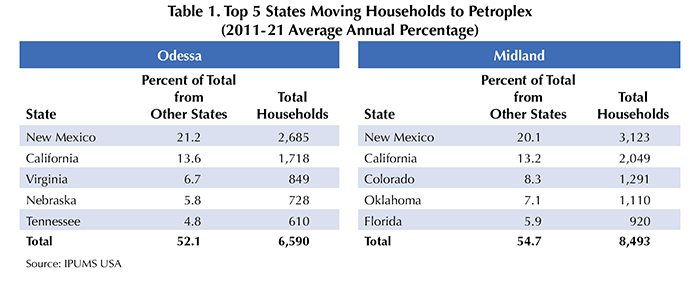
Out-of-state households came to Odessa from 28 different states between 2011 and 2021. However, the top five states accounted for 52.1 percent of the total. Meanwhile, households relocating to Midland came from 31 states, with the top five accounting for 54.7 percent of the total. New Mexico and California were the top two states sending migrants to both MSAs (Table 1). The year with the highest total out-of-state migration was 2013, a year when WTI price peaked at $107 per barrel ($140 per barrel in 2023 inflation-adjusted dollars).
Total households moving to Midland, including those from within Texas and from other states, exceeded 43,000. In-state moves were 64 percent, or about two thirds, of the total. Odessa’s total moves exceeded 34,000, with 62 percent coming from inside Texas. The median age of all movers over the age of 18 was 36 for folks moving to Midland and 35 for those moving to Odessa.
Average household incomes for the 11-year period were somewhat similar for in-state and out-of-state movers, although incomes varied widely by year. For Midland, the average was $79,600 for out-of-state movers and $81,400 for in-state movers. Odessa’s averages were lower at $67,600 for out-of-state movers and $65,900 for those coming from within Texas. The average household income for the state during the same period came in significantly lower at $58,500.
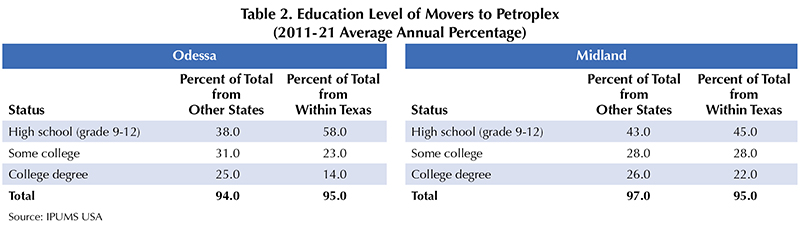
Educational attainment showed mixed results. From 2011 to 2021, Odessa exceeded Midland in the percentage of movers from inside Texas who had some high school education. The percentage of college graduates moving from out of state was almost the same for both cities. The percentage of movers from out of state with some high school education moving to Midland was greater than the percentage moving to Odessa (Table 2). The highest percentage of college graduates moving to Midland from out of state (48 percent) occurred in 2011, while the peak year for Odessa was 2021 (74 percent).
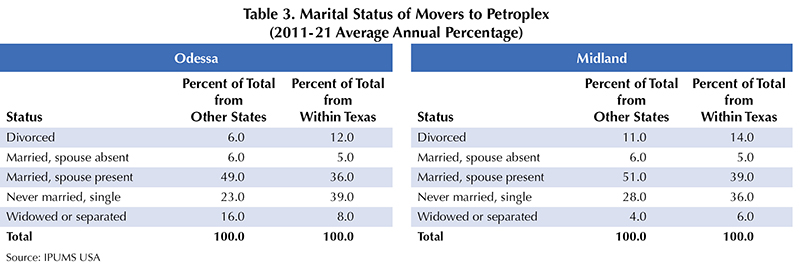
Marital status is often a factor when deciding what type of housing to occupy. Married movers from outside Texas were much more likely to bring a spouse with them than those moving from within Texas. Conversely, a greater percentage of single movers came from within Texas than from other states (Table 3).
All movers overwhelmingly selected rentals over homeownership as their housing choice in both MSAs. The average homeownership rate for out-of-state movers from 2011 to 2021 was higher in Odessa (31 percent) than in Midland (23 percent). Conversely, the average homeownership rate during the same period for in-state movers was higher in Midland (30 percent) than in Odessa (26 percent).
Peak homeownership rates for out-of-state movers by year occurred in 2020 for Midland and 2016 for Odessa. Both were years when the average 30-year mortgage rate based on Freddie Mac data was quite low at 3.1 percent for Midland and 3.7 percent for Odessa. Average homeownership rate by nonmovers was extremely high at 75 percent for Midland and 73 percent for Odessa. The overall U.S. homeownership rate varied between 64 and 66 percent during the same 11-year period.
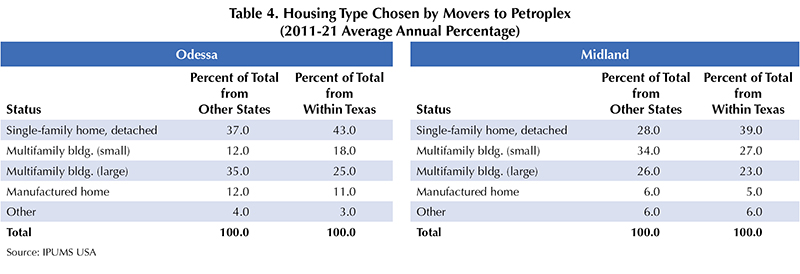
On the whole, movers favored multifamily properties over single-family homes. In-state movers chose to live in single-family homes more often than out-of-state movers. Manufactured housing was a more popular choice in Odessa than in Midland for both in-state and out-of-state movers (Table 4).
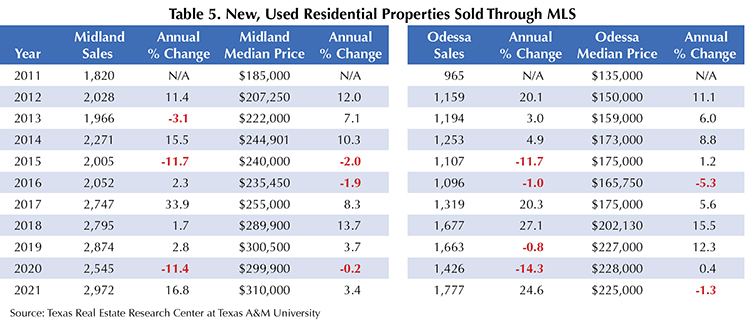
Fluctuations in annual home sales and median prices were similar for the two cities, but they were by no means identical (Table 5). Moderately similar periods of lower sales and prices are evident in 2015 and 2020. Rig count, WTI price, and employment growth all trended downward during both years. Periods of increasing sales and prices were similar in 2012, 2017, and 2021. WTI price, rig count, and employment peaked in 2012 and 2017. However, only WTI price and employment were strengthening in 2021. Rig count was extremely low, bottoming in August of that year.
Impact on Labor Force Trends
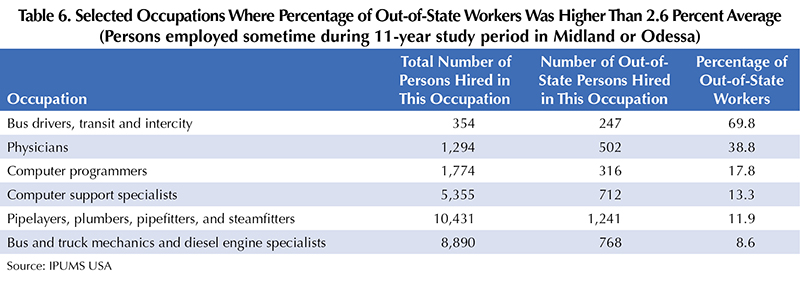
IPUMS data reported 546 specific job categories for all workers employed in either Midland or Odessa from 2011 to 2021. The total number of workers employed in all 546 occupations during the 11-year period averaged over 181,000 per year. Restricting the count of job categories to occupations where at least one employee relocated from outside Texas, that number drops to 167. Just under 53,000 people working in these occupations came from other states during the 11-year study period, an average of approximately 4,800 per year or 2.6 percent of the total workforce.
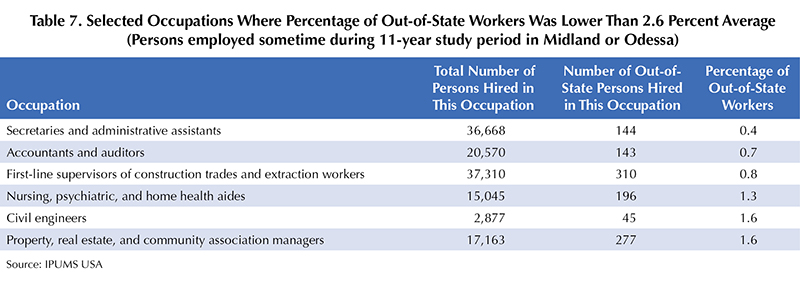
Of those 167 occupations, 106 logged employment proportions by out-of-state workers higher than 2.6 percent, meaning those 106 occupations employed a higher-than-average number of out-of-state workers. Although all occupations cannot be listed, a selected sample of more familiar occupations with higher- and lower-than-average employment by out-of-state workers is shown in Tables 6 and 7.
Both Odessa and Midland employed workers in 424 of the 546 occupations during the 11-year study period. Workers employed in an occupation in Midland averaged just under 94,000 per year, while Odessa averaged approximately 87,000 per year, a somewhat even split.
Comparing Texas, Midland, Odessa Wage Rates
U.S. Bureau of Labor Statistics individual job category wage data for 2022 for Texas, Midland, and Odessa were used to show inequalities between wage rates by geography (Table 8). Unfortunately, only some of the 546 total occupations reported wages for all three geographies.

Still, a selected comparison of wages shows disparities do exist that could cause workers to migrate from other parts of Texas to Midland or Odessa for higher pay.
Although oil and gas prices are impossible to predict, Midland and Odessa’s position as a global competitor in their production should continue to be a magnet for both out-of-state and in-state workers for the foreseeable future.
____________________
Dr. Hunt ([email protected]) is a research economist, Natarajan ([email protected]) a senior data analyst, and Chatterjee a research intern with the Texas Real Estate Research Center at Texas A&M University.
Did you like this Article?
You might also like

PUBLISHED SINCE 1977
TG Magazine
Check out the latest issue of our flagship publication.