Texas’ Gulf Coast–Brazos Bottom region registered the highest price per acre at $4,837 in 2011. Sales volume remained low throughout the state.
Jul 20, 2012
Land Watch
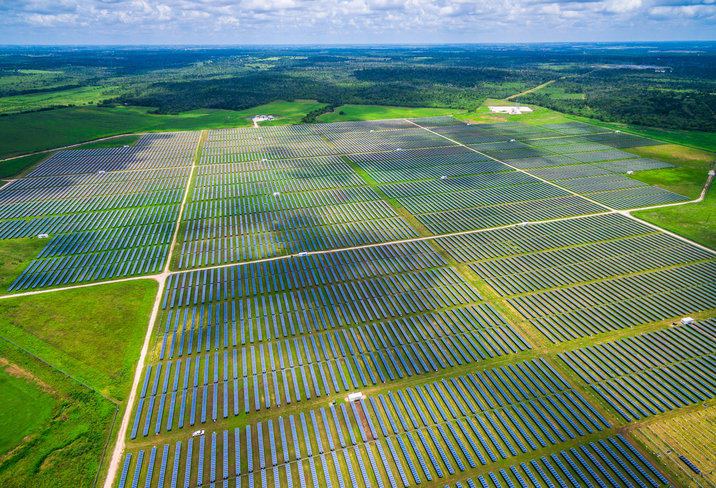
Texas land markets encompass widely varying land types, including irrigated, cropland, desert land, native rangeland and timber land. The region-by-region article covers which types are selling and which are not.

Texas regional land market price trends in 2011 reflected variations in market dynamics. The Panhandle, West Texas and Wichita Falls areas posted price improvements, while northeast and Central Texas prices lagged behind 2010 levels. Demand for transitional and development tracts weakened and recreational land buyers were scarce.
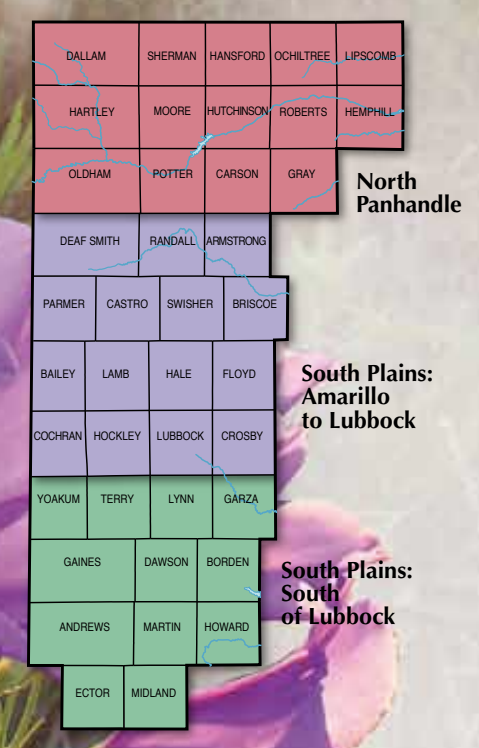
Region 1— Panhandle and South Plains
More than any other region in Texas, the Panhandle and South Plains is dominated by farming. It encompasses the greatest concentration of cropland, accounting for 62 percent of irrigated acres and 41 percent of dryland acres statewide.
Activity in farmland markets made 2011 a remarkable year for both buyers and sellers. Specifically, the continuing robust demand for cropland boosted regionwide land prices to an all-time high of $946 per acre in 2011, an enormous 20 percent increase from 2010 price levels. However, that price measured in real 1966 dollars settled in at $174 per acre, falling to top price levels seen from 1974 to 1982.
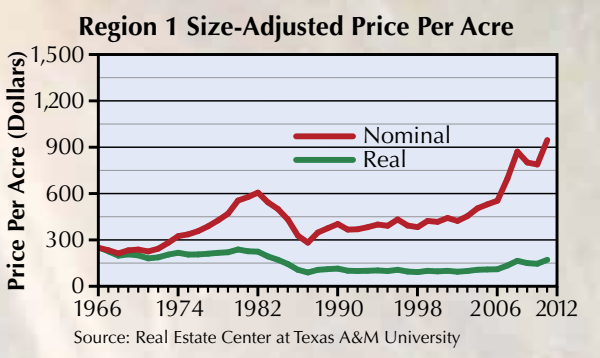

At 472 reported sales, volume of activity lagged below the long-term average. However, the slow pace of sales occurred partly because high commodity prices prompted many current owners to refrain from selling. That left would-be buyers to compete for limited available supplies.
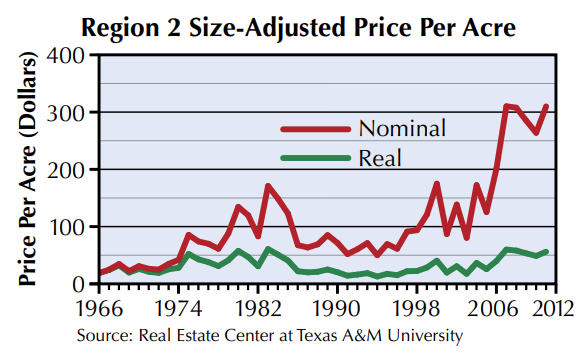
Region 2 — Far West Texas

With vast expanses of arid land, this region typically books few sales and has large price variations. Desert rangeland normally sells at low prices per acre in large tracts while the available irrigated farmland commands relatively high per-acre prices. The small number of sales reported in this region means the data are not a strong indicator of land prices in the area.
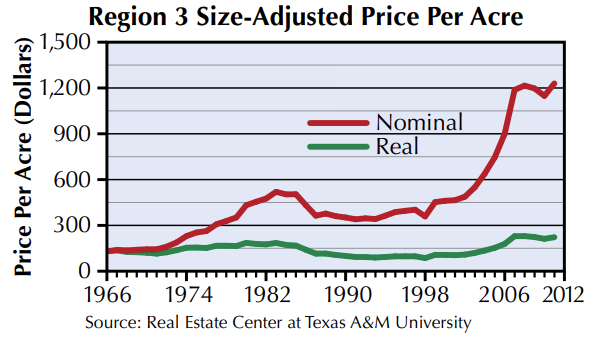
Region 3 — West Texas
Native range dominates this region, accounting for nearly 77 percent of the total acreage. In addition, the area contains a substantial farming presence (16 percent of total acreage) mostly focused on dryland cropland.
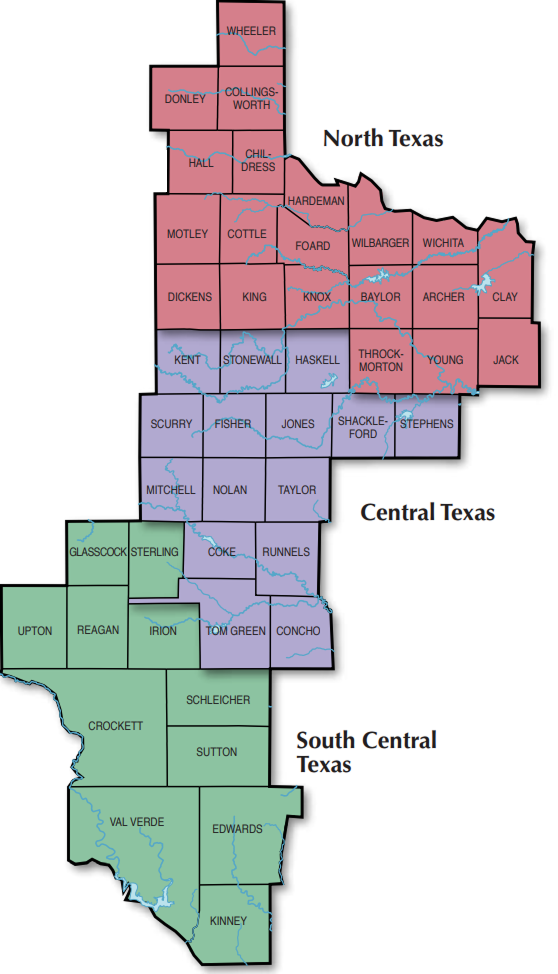
Interest in cropland and rangeland provided a lift to regional land prices, raising the average price 7 percent to $1,230 per acre. That increase followed two years of declining prices. The recovery was narrowly focused, however, with only 568 sales posted, the lowest volume since 1997. Typical tract size remained steady at 160 acres.
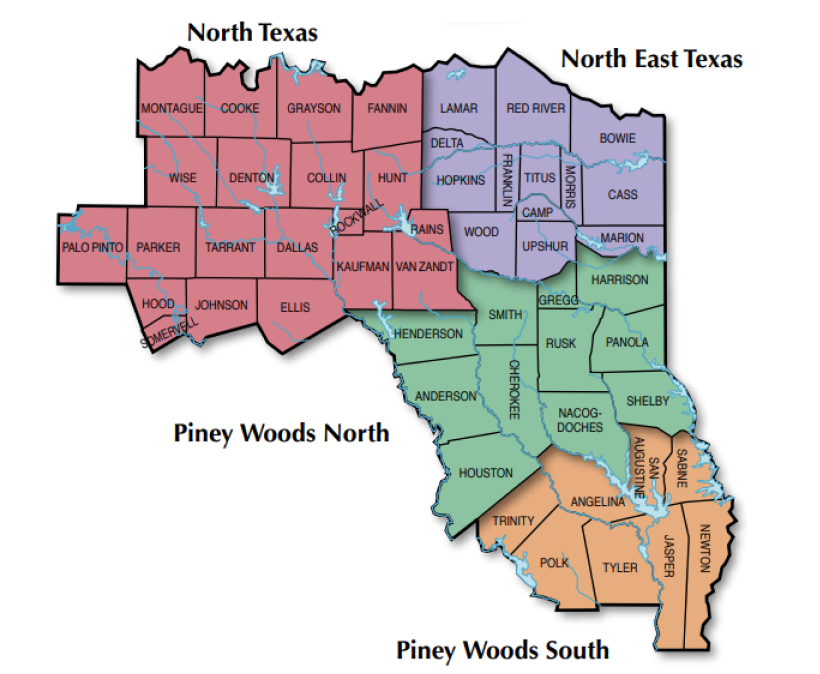
Region 4 — Northeast Texas
Rural land markets in this region reflect influences from its sizable and growing urban areas. Demand for recreational use competes with timber production. More than 57 percent of the area is used for grazing, while 33 percent is dedicated to timber production.
After suffering a sizable drop in price per acre in 2009 as recession plagued the economy, the trend seemed to ease in 2010 only to drop back to $2,979 per acre in 2011. In real terms, that average price matches the price posted in 2005.
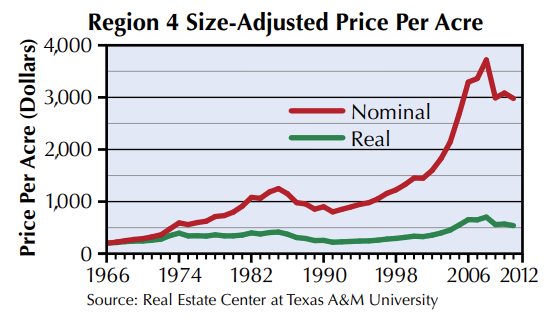
Sales activity expanded to 816 sales from the meager volume of 606 sales in 2009 but remained well below 2004–06 volumes, which exceeded 1,000 sales. The 3 percent price decline suggests that recessionary forces continue to dampen demand in this region.
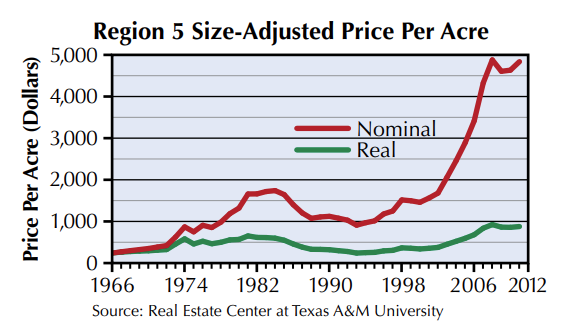
Region 5 — Gulf Coast-Brazos Bottom
Landowners in this region maintain 58 percent of rural land in its native range state with an added 14 percent dedicated to improved pasture. Although pockets of timber and cropland dot the region, urban development and expanding population centers drive much of the demand in this area.
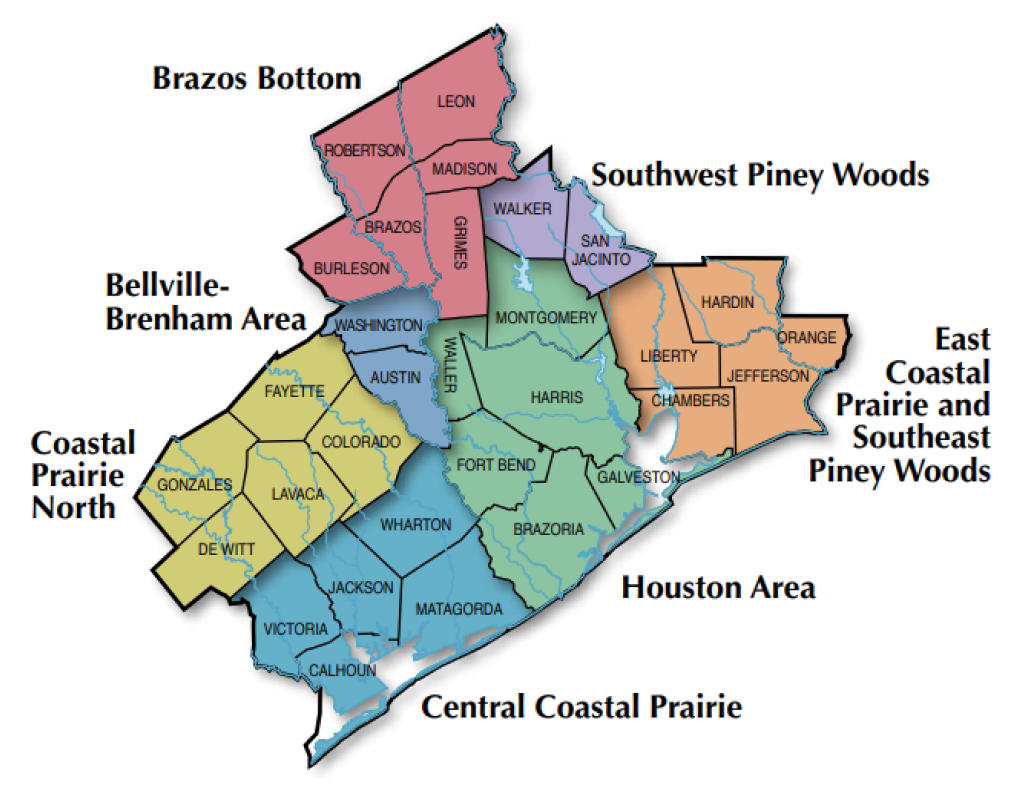
The strong energy market contributed to growing incomes, supporting demand, especially adjacent to Houston, the dominant economic engine. Still, the market managed only a 4 percent increase to $4,837 per acre and a muted sales volume of 781 for the year. Sales concentrated on small properties, registering a median size of 33 acres. The past three years have recorded similar size and volume trends.
Region 6 — South Texas
This region is composed of the fringe of the Edwards Plateau, South Texas brush country, the coastal plains and Lower Rio Grande Valley. It encompasses large areas of sparsely populated ranches as well as large metropolitan areas.
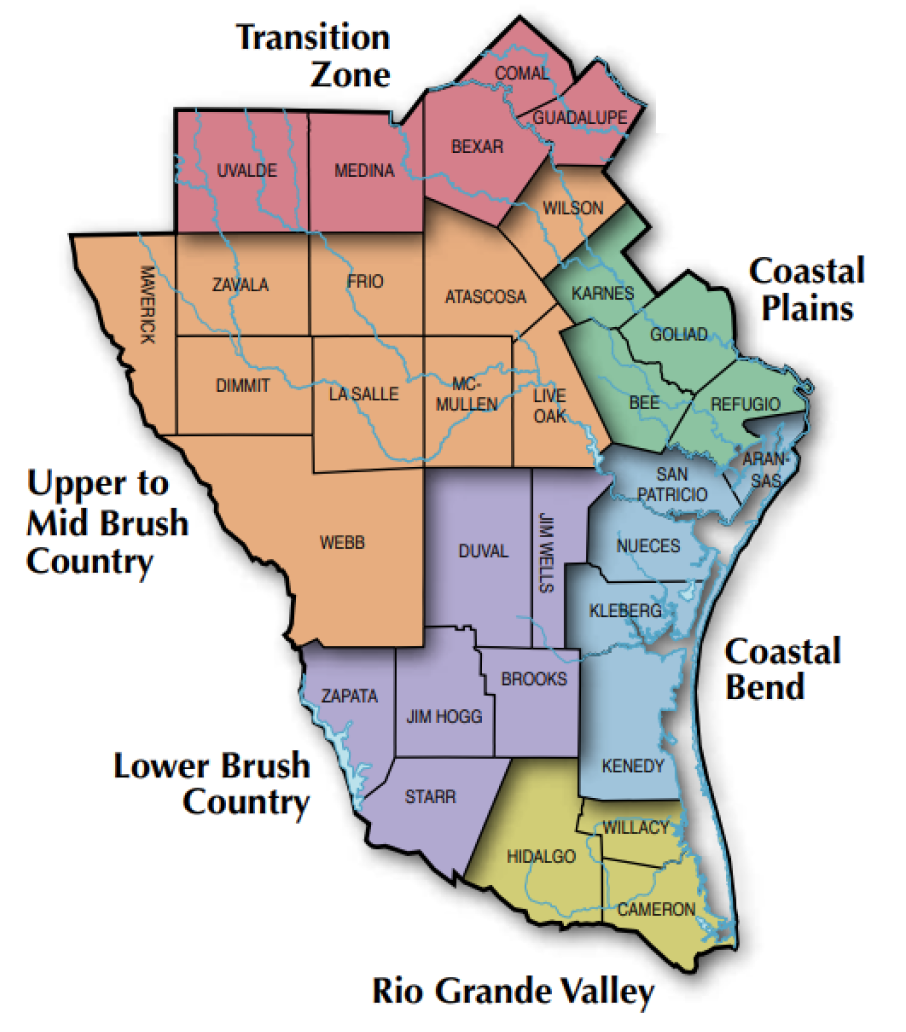
The region is well-known for an abundance of superior quality wildlife. Ranchers and recreational users keep nearly 68 percent of its acreage in native rangeland. Sizable expanses of cropland make up about 20 percent of the acreage, evenly split between irrigated and dryland cropland.
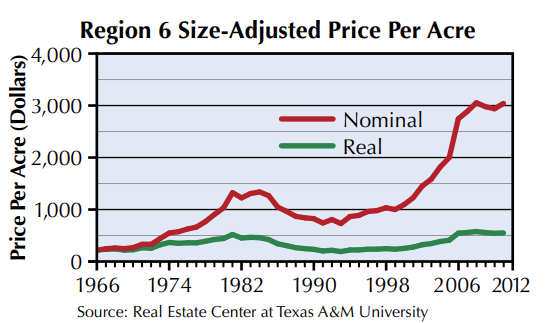
Markets in this region began to slow early in the recession. At $3,040 per acre, real prices are about the same as in 2007. Sales volume dropped in the past three years, with 498 sales posted in 2011. This volume matched 1990-era markets. Development of the Eagle Ford Shale oil and gas play promises to permanently change this area. The influx of people and capital will likely impact land markets for years to come.
Region 7 — Austin-Waco-Hill Country
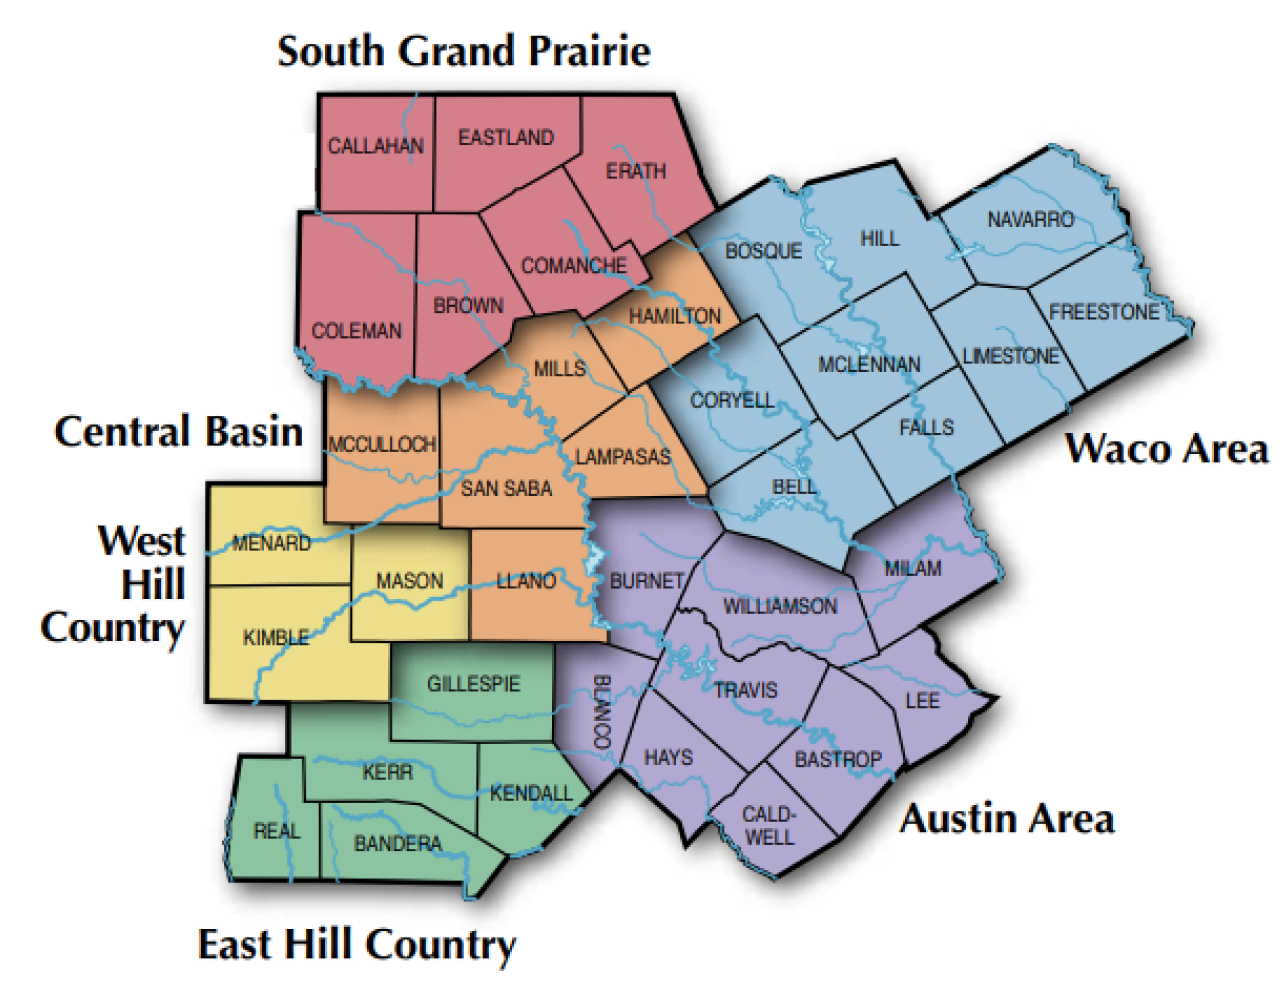
Land use in this region is dominated by grazing, which accounts for more than 82 percent of acreage. Prices have been stagnant since 2007 with a low of $3,041 per acre in 2009 and the 2011 price at $3,109 per acre. Sales volume continued at a depressed level with 1,371 transactions recorded. The median 65 acres per transaction continued a four-year sales trend toward small properties.

Dr. Gilliland ([email protected]) is a research economist, Klassen ([email protected]) is a research analyst, and Garcia and Adame are research assistants with the Real Estate Center at Texas A&M University.
Did you like this Article?
You might also like

Land Markets
10 minute read
Aug 20 2025
Texas Rural Land Markets | Second Quarter 2025
The second quarter saw a continuation of the rising year-over-year price change, defying expectations, coming in at 4.60 percent. Comparing year-to-date sales from 2Q2024 to 2Q2025 across the 33 Land Market Areas, the sales volume was down in 18 LMAs and down 11 percent overall.