Research findings indicate an ongoing recovery in the DFW housing market. The percentage of distressed home sales relative to total sales has declined, and the average price of distressed sales has risen. As the distressed sale proportion declines, expect the price discount for such sales to decrease.
Jan 7, 2014
Metroplex Market on the Mend
Center research used Dallas-Fort Worth area Multiple Listing Service sales data to measure the housing boom-bust’s and 2007’s Great Recession’s effects on the housing market. Distressed sales — how many and for how much — document how the recovery is going.

The Dallas-Fort Worth (DFW) housing market, like many others around the country, had a surge and then decline in foreclosed and financially distressed residential properties coming to market from 2003 to 2011. The Real Estate Center researched the impact of the recent housing boom-bust cycle and the Great Recession of 2007 on major Texas metropolitan housing markets. The study was based on DFW home sales transaction data from October 2003 to June 2013 obtained from the North Texas Real Estate Information Services Multiple Listing Service.
The research found that the mortgage rate and the area’s unemployment rate were the main factors behind the level of distressed sales in the DFW market. The 2003–08 upward trend in the sales of distressed homes was associated with a short-run, slightly upward trend in mortgage rates coupled with loose credit and exacerbated by a rising unemployment rate. Declines in both mortgage and unemployment rates due to economic stimulus policies and the general recovery of the U.S. economy since 2010 resulted in fewer distressed sales and improvement in DFW nondistressed housing prices.
Dallas Housing in the Great Recession
Texas did not record a house price bubble thanks to the availability of low-cost land and flexibility of the local housing markets’ supply side. But the state’s local housing markets suffered a setback initially because of increasing mortgage rates and later the Great Recession.

DFW’s upward trend in distressed homes sold in the early 2000s peaked toward the end of 2008 followed by a slow, downward trend (Figure 1). The number of distressed homes sold increased from 437 units in October 2003 to an all-time high of 1,379 in April 2008. The smoother moving average of distressed homes sold, that is, the average of the past 12 months recalculated for each month, rose to a record high of 1,204 in March 2009.
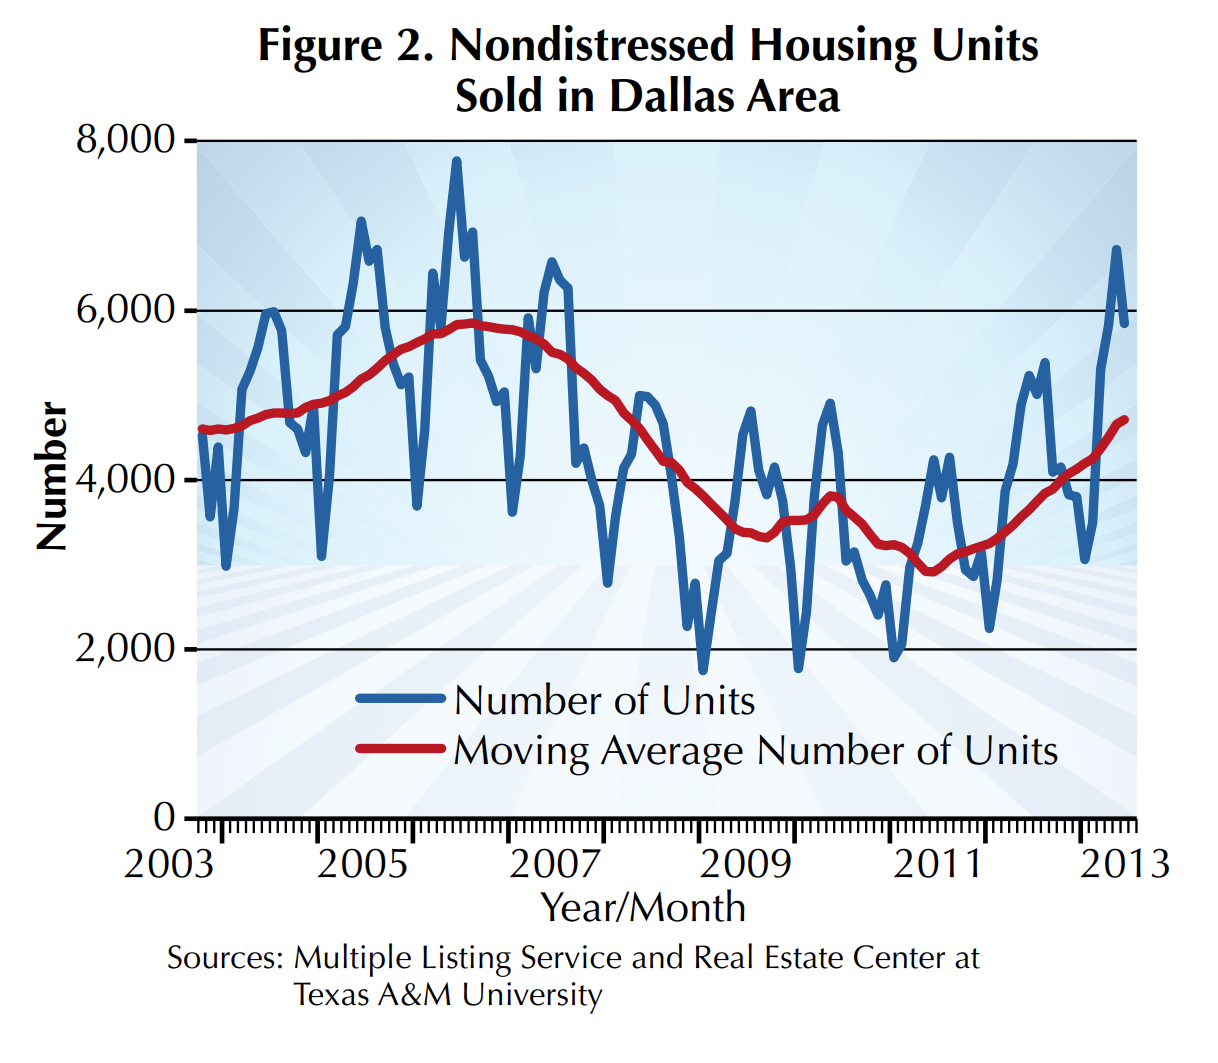
By comparison, nondistressed homes sold increased from 4,529 units in October 2003 to a record of 7,762 units in June 2006. The moving average of nondistressed homes sold hit an all-time high of 5,855 units in August 2006 (Figure 2).
Dividing the number of distressed homes sold by the total number of homes sold in each month gives the percentage of distressed homes sold (Figure 3), together with the moving averages of the percentages. The percentage of distressed homes sold fluctuated around 10 percent until January 2006. The moving average increased from 6.3 percent in October 2003 to 11.7 percent in February 2005 and fell to 9.8 percent in March 2007. From the end of 2006, the percentage of distressed homes sold rose sharply, reaching a peak of 36.5 percent in January 2009 (Figure 3). The 12-month moving average reached its peak of 26.7 percent in May 2009.

A number of Federal Reserve policy initiatives, the Housing and Economic Recovery Act of 2008, and the American Recovery and Reinvestment Act of 2009 resulted in a downward trend in the number and percentage of distressed homes sold in late 2009 and early 2010. The moving average of the percentage of distressed homes sold fell to 22.3 percent in May 2010. However, mainly because the national economy’s recovery was fragile, the trend was temporary, and the moving average percentage resumed an upward trend that lasted until June 2011, when it was 26.3 percent. The percentage of distressed homes sold fell to 14.7 percent in June 2013, still nearly double the pre-Great Recession level.
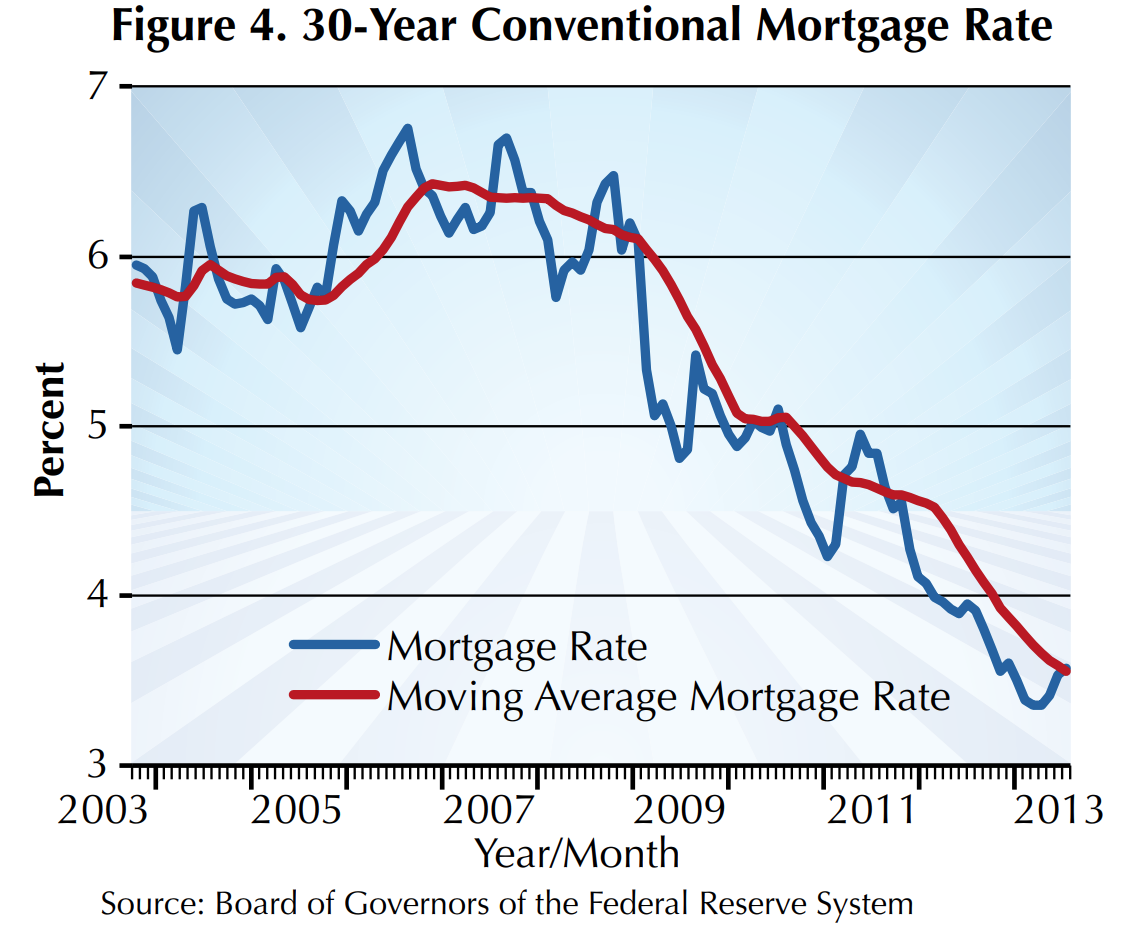
The rise and fall of the percentage of distressed homes sold in the DFW area closely correlated with the rise and fall of long-term mortgage rates and the local area’s unemployment rate. The moving average rate for 30-year conventional mortgage loans was less than 6 percent from October 2003 to April 2006, coinciding with low rates of distressed homes sold (Figure 4). The moving average mortgage rate rose from 5.74 percent in August 2005 to 6.43 percent in October 2006 and remained above 6 percent until the end of 2008 when it began a steady decline to around 3.5 percent.

The higher percentage of distressed homes sold was even more significantly fueled by growing unemployment in the area throughout the Great Recession (Figure 5). The average unemployment rate nearly doubled from just over 4 percent in 2008 to more than 8 percent during most of 2010–11.
While higher mortgage rates triggered growing distressed sales, falling mortgage rates did not reduce distressed sales until the rate fell to less than 5 percent in 2010 (Figures 3 and 4). Facilitated by mortgage rates less than 5 percent from mid-2010 and a falling unemployment rate from the end of 2011, the percentage of distressed homes sold in the DFW area began falling in mid 2011, a trend that continues.
Distressed, Nondistressed Home Prices
With abundant supplies of land, a relatively more efficient land acquisition and development process, and a milder general recession, Texas’ local housing markets, including DFW, the state’s largest housing market, avoided a major home price bubble-bust cycle. However, the overall housing downturn that evolved led to growing sales of distressed housing units, which affected overall home prices. The average selling price of nondistressed homes from October 2003 to June 2013 was $194,824; the low was $166,750 and the high $230,955 (Figure 6). The average selling price of distressed homes was $111,129, with a minimum of $96,792 and a maximum of $123,441 (Figure 7).


Nondistressed home sales prices trended upward from 2003 until February 2009 when the moving average selling price reached $200,287 (Figure 6). The moving average selling price fell to $193,280 in May 2010, a decrease of 3.6 percent from the previous peak. Distressed home sales prices steadily declined through 2011 (Figure 7).

Dividing distressed home sales prices by sales prices of nondistressed homes and multiplying by 100 gives a time series of distressed prices as percentages of nondistressed prices together with 12-month moving averages (Figure 8). Before foreclosures increased in 2007, there were minor changes in the average trend. Distressed prices ranged roughly between 60 and 65 percent of nondistressed prices. A downward trend began in 2007 and continued through 2009. It became steeper in 2010 and 2011 and stabilized in 2012 and 2013 at historically low levels, around 52 percent. After dipping in 2009 and 2010, nondistressed home prices showed a recovery, climbing consistently from mid2011. Distressed home prices were still falling in 2011 but started a weaker upward trend in 2012 and early 2013.
Distressed Sales’ Impact on Home Prices
The ratios of distressed-to-nondistressed prices relative to the ratio of distressed-to-nondistressed unit sales are illustrated in a scatter diagram (Figure 9). The computed trend line shows a significantly negative relationship between the price ratio and the sales ratio. That is, as the percentage of distressed unit sales increases, the ratio of distressed-to-nondistressed price declines. A smaller price ratio translates into a larger price discount for distressed properties. A 62 percent price ratio, for example, means that distressed properties sell for 38 percent less than nondistressed properties.

Similarly, a lower price ratio, say 56 percent, means that distressed properties sell for a 44 percent discount. The overall trend line indicates that if the percentage of distressed sales increased by 10 percent, say from 20 percent to 30 percent, the percentage of distressed-to-nondistressed prices dropped from 59.5 percent to 57.8 percent.
Dr. Anari ([email protected]) and Dr. Gaines ([email protected]) are research economists with the Real Estate Center at Texas A&M University.
Did you like this Article?


