Texas’ housing market has been more affordable than the nation’s as a whole for years, but the gap between the two has narrowed recently as the state’s affordability growth has begun to slow.
Mar 6, 2020
Still on Top
Texas Homeownership Affordability Growing but Slowing
Texas can still boast about staying ahead of the country as a whole in housing affordability, but for how long? The gap is narrowing.
Homeownership affordability is about owners’ costs and incomes and changes over time in incomes, mortgage interest rates, property taxes, insurance, and maintenance costs. Growing personal incomes and lower mortgage rates have improved Texas homeownership affordability in the aftermath of the recovery from the Great Recession (GR), but the upward trend has slowed in recent years.
The Real Estate Center looked at Texas affordability trends using time series of the shares of housing units with homeownership costs that were:
- 24.9 percent or less of household income (affordable),
- between 25 to 49.9 percent (less affordable), and
- 50 percent or more (least affordable).
According to the U.S. Census Bureau, many government agencies define “excessive” homeownership costs as those that exceed 30 percent of household income.
Texas, U.S. Homeownership Affordability Trends Compared
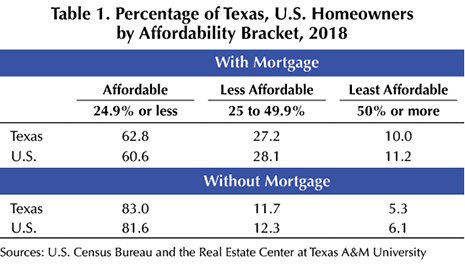
Among Texas homeowners with a mortgage, 62.8 percent were in the “affordable” bracket, more than the nation’s 60.6 percent (Table 1). These were up from 55.8 percent in 2010 for Texas and 49.9 percent for the U.S. (Figure 1). Although the percentage of Texas homeowners in this group has stayed higher than the nation’s, the gap narrowed from 5.9 percentage points in 2010 to 2.2 percentage points in 2018 as Texas affordability growth slowed after 2016.
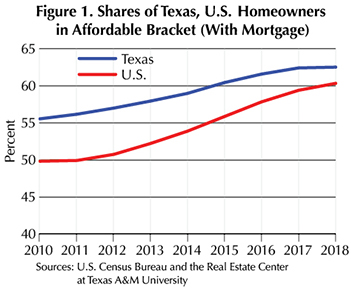
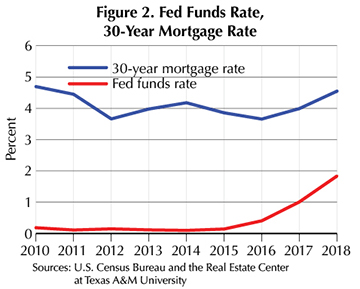
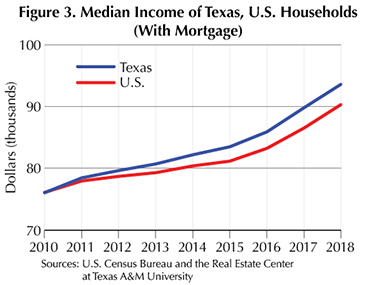
Affordability improvements for both the state and the nation were due to growing personal incomes in the aftermath of the recovery from the GR and the lowering of mortgage rates by the Federal Reserve System to help U.S. housing markets (Figure 2). Median family income of Texas homeowners with mortgages rose from $76,040 in 2010 to $93,660 in 2018 compared with $76,110 to $90,360 nationally (Figure 3). As the 30-year mortgage rate trended upward from 3.65 percent in 2016 to 4.54 percent in 2018, affordability growth for both the state and the nation slowed (Figure 1).
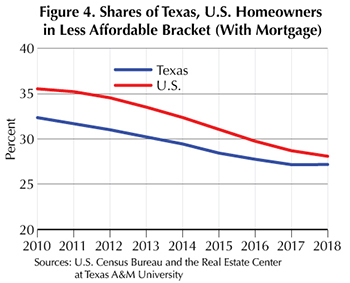
Of Texas homeowners with a mortgage, 27.2 percent were in the “less affordable” category in 2018, less than the nation’s 28.1 percent (Table 1). In 2010 those numbers were 32.4 percent for Texas and 35.5 percent for the U.S. (Figure 4). The share of homeowners in this group has stayed lower in Texas than in the nation as a whole, but the gap narrowed from 3.1 percentage points in 2010 to 0.9 percentage points in 2018.
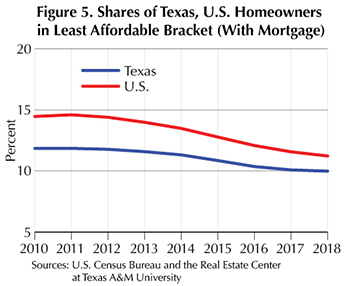
Ten percent of Texas homeowners with mortgages fell under “least affordable” in 2018, less than the nation’s 11.2 percent (Table 1). These were down from 11.8 percent in 2010 for Texas and 14.5 percent for the U.S. (Figure 5). The size of this group has stayed lower in Texas than nationally, but the gap narrowed from 2.7 to 1.2 percent between 2010 and 2018.
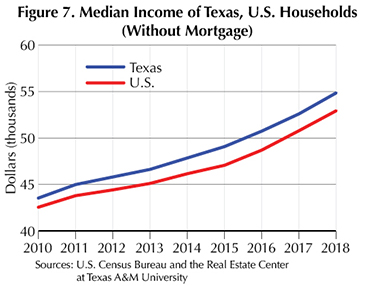
In 2018, 83 percent of Texas homeowners without a mortgage were in the “affordable” bracket, higher than 81.6 percent for the U.S. (Table 1). These percentages trended upward from 80.5 percent in 2010 for Texas and 79.3 percent for the U.S. (Figure 6). The percentage in this group remains higher in Texas than in the nation as a whole, but both upward trends have slowed since 2017. Growing personal incomes in the aftermath of the recovery from the GR have helped improve affordability for both the state and the nation. Median family income of Texas homeowners without mortgages rose from $43,440 in 2010 to $54,850 in 2018. Nationally, they rose from $42,450 to $52,910 during the same period (Figure 7).

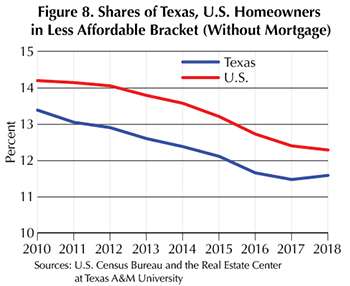
Among Texas homeowners without mortgages, 11.7 percent were in the “less affordable” bracket in 2018, less than the nation’s 12.3 percent (Table 1). In 2010, those numbers were 13.4 percent for Texas and 14.2 percent for the U.S. (Figure 8). The size of this group has stayed smaller in Texas than in the U.S. but has changed little since 2017.
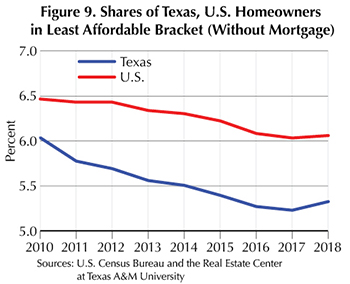
Of Texas homeowners without mortgages, 5.3 percent were in the “least affordable” bracket in 2018, less than the nation’s 6.1 percent (Table 1). These were down from 6 percent in 2010 for Texas and 6.5 percent for the U.S. (Figure 9). The size of this group in Texas has stayed smaller than in the U.S., but it has trended slightly upward since 2017.
Affordability in Texas MSAs
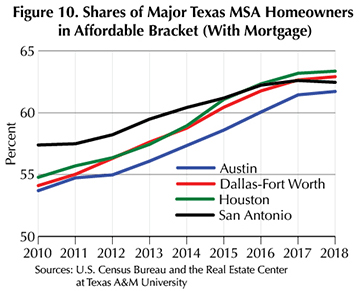
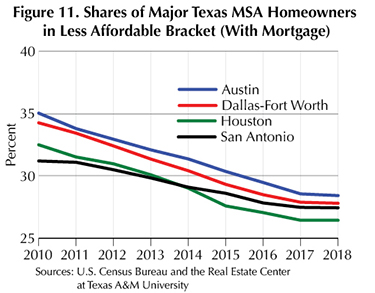
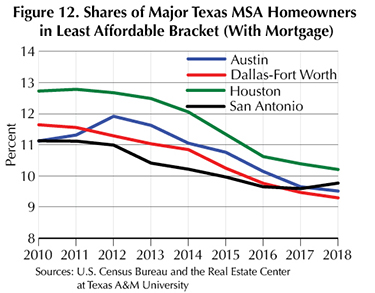
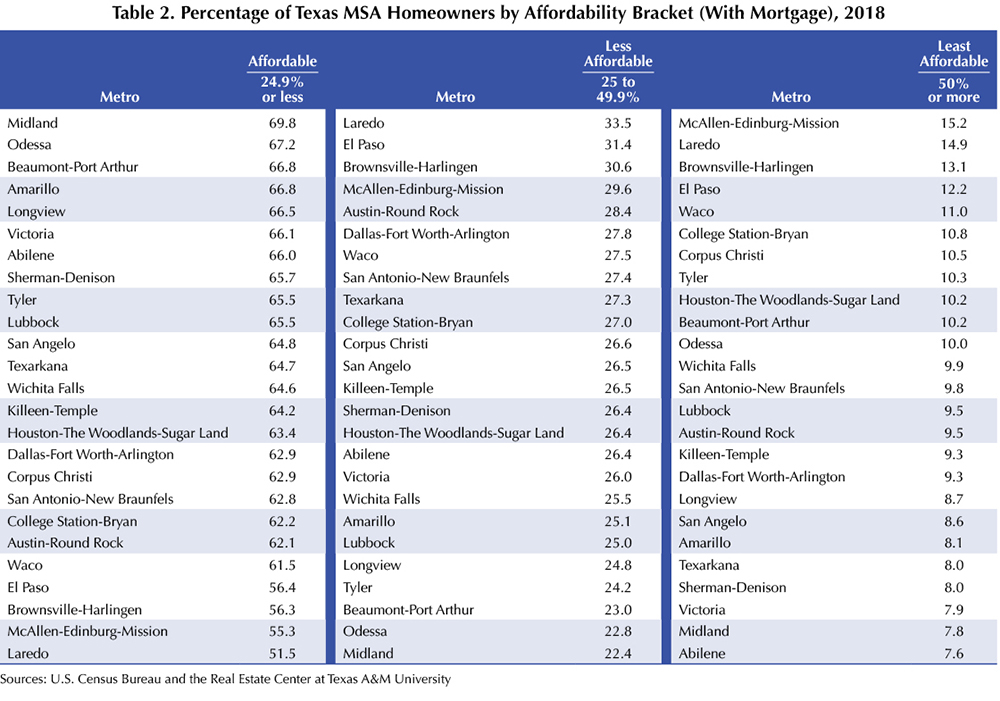
In Austin, Dallas-Fort Worth, Houston, and San Antonio, shares of homeowners with mortgages in the “affordable” bracket have trended upward from 2012, but the growth rates have slowed since 2017 (Figure 10). Shares of homeowners in the “less affordable” bracket have trended downward, but that trend slowed after 2016 (Figure 11). Shares in the “least affordable” bracket have trended downward since 2012, but that slowed after 2016 in Austin, Dallas-Fort Worth, and Houston, while in San Antonio it turned upward (Figure 12). For a breakdown of all Texas MSA homeowners with a mortgage by affordability bracket, see Table 2.
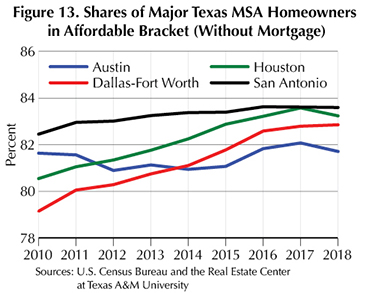
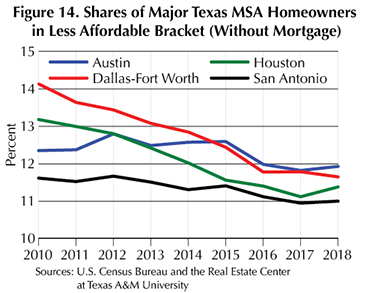
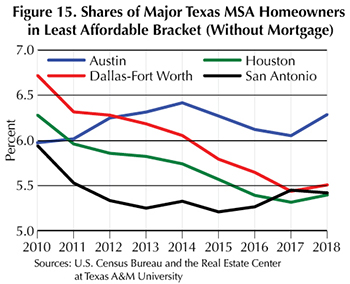
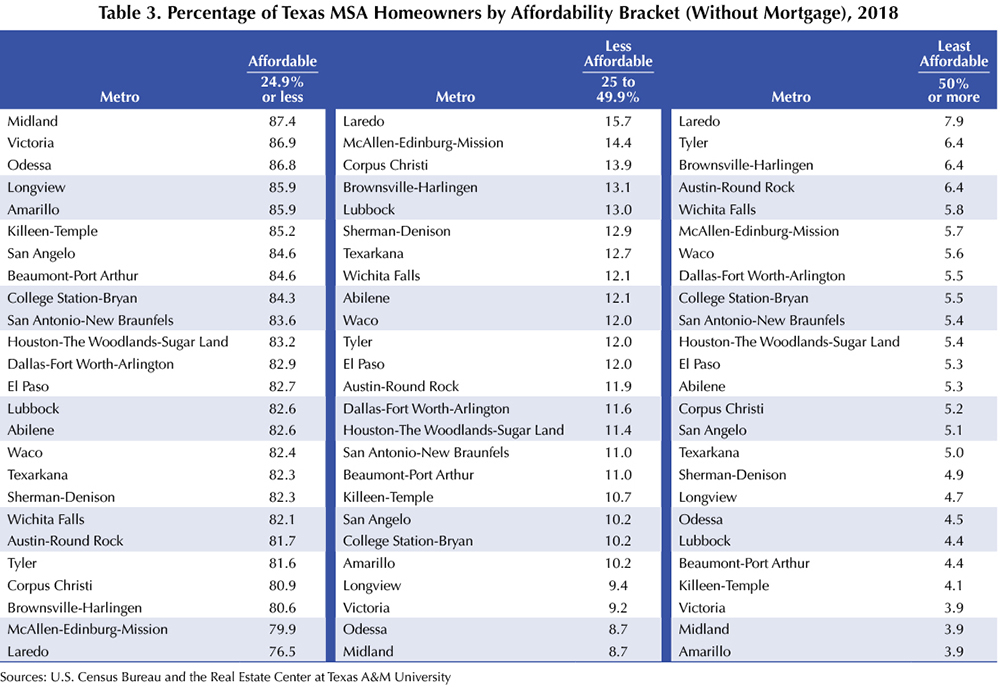
The share of homeowners without mortgages in the “affordable” bracket was highest in San Antonio in 2018 followed by Houston, Dallas-Fort Worth, and Austin (Figure 13). Since 2017, shares have decreased in Austin and Houston. The share of homeowners in the “less affordable” bracket was highest in Austin in 2018 followed by Dallas-Fort Worth, Houston, and San Antonio (Figure 14). Since 2017, shares have trended upward in Austin and Houston. In the “least affordable” bracket, the share was highest in Austin in 2018 followed by Dallas-Fort Worth, San Antonio, and Houston (Figure 15). Since 2017, shares have trended upward in Austin, Dallas-Fort Worth, and Houston. For a breakdown of Texas MSA homeowners without a mortgage by affordability bracket, see Table 3.
____________________
Dr. Anari ([email protected]) is a research economist with the Real Estate Center at Texas A&M University.
Did you like this Article?
You might also like

5 minute read
May 08 2019
Keeping House
Location's Impact on Homeownership Affordability
Buying a house is one thing; keeping it is another. Homeownership affordability depends on a myriad of factors that vary from state to state and even city to city. Here’s how Texas and many of its cities measure up.


