Texas Border Economy | March 2022
Economic indicators along the Texas-Mexico border were positive. Payrolls in border Metropolitan Statistical Areas (MSAs) increased quarterly.

Texas Border Economy is a summary of important economic indicators that help discern trends in the housing markets along the Texas-Mexico border.

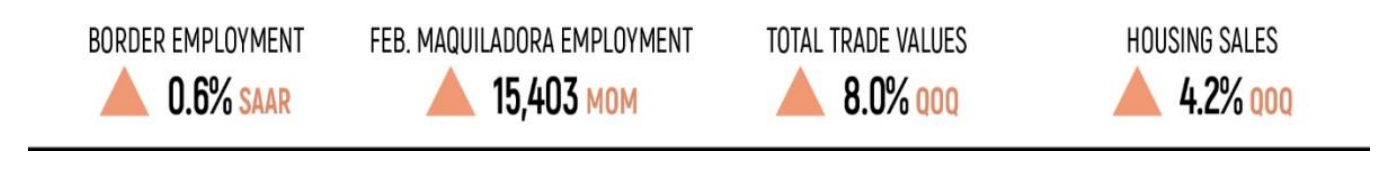
Economic indicators along the Texas-Mexico border were positive. Payrolls in border Metropolitan Statistical Areas (MSAs) increased quarterly. Construction activities decreased while trade values improved during the first quarter of the year. Problems like growing inflation, scarcity of raw materials, and low availability of truck drivers persisted in 1Q2022. Housing sales increased primarily due to declining home prices and improved affordability, but high demand and depleting inventory remained a challenge. In addition to COVID-19-related supply-chain disruptions, the global economy is facing an unpredictable course of action in eastern Europe as Russia’s aggression in Ukraine disrupted the global economy and international trade. Rising inflation and interest rates can hamper the demand and overall border economy in the future.
Economy
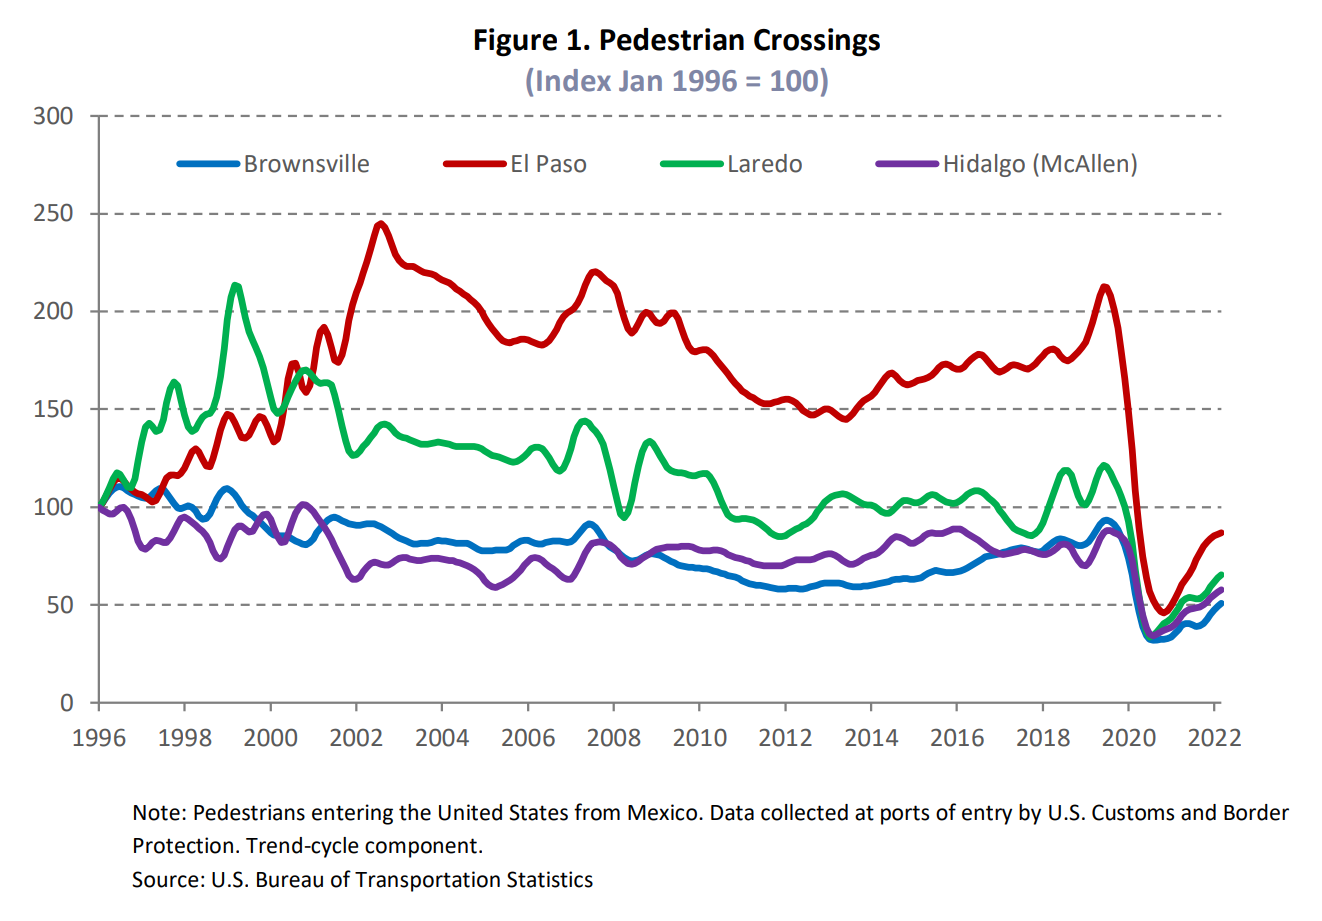
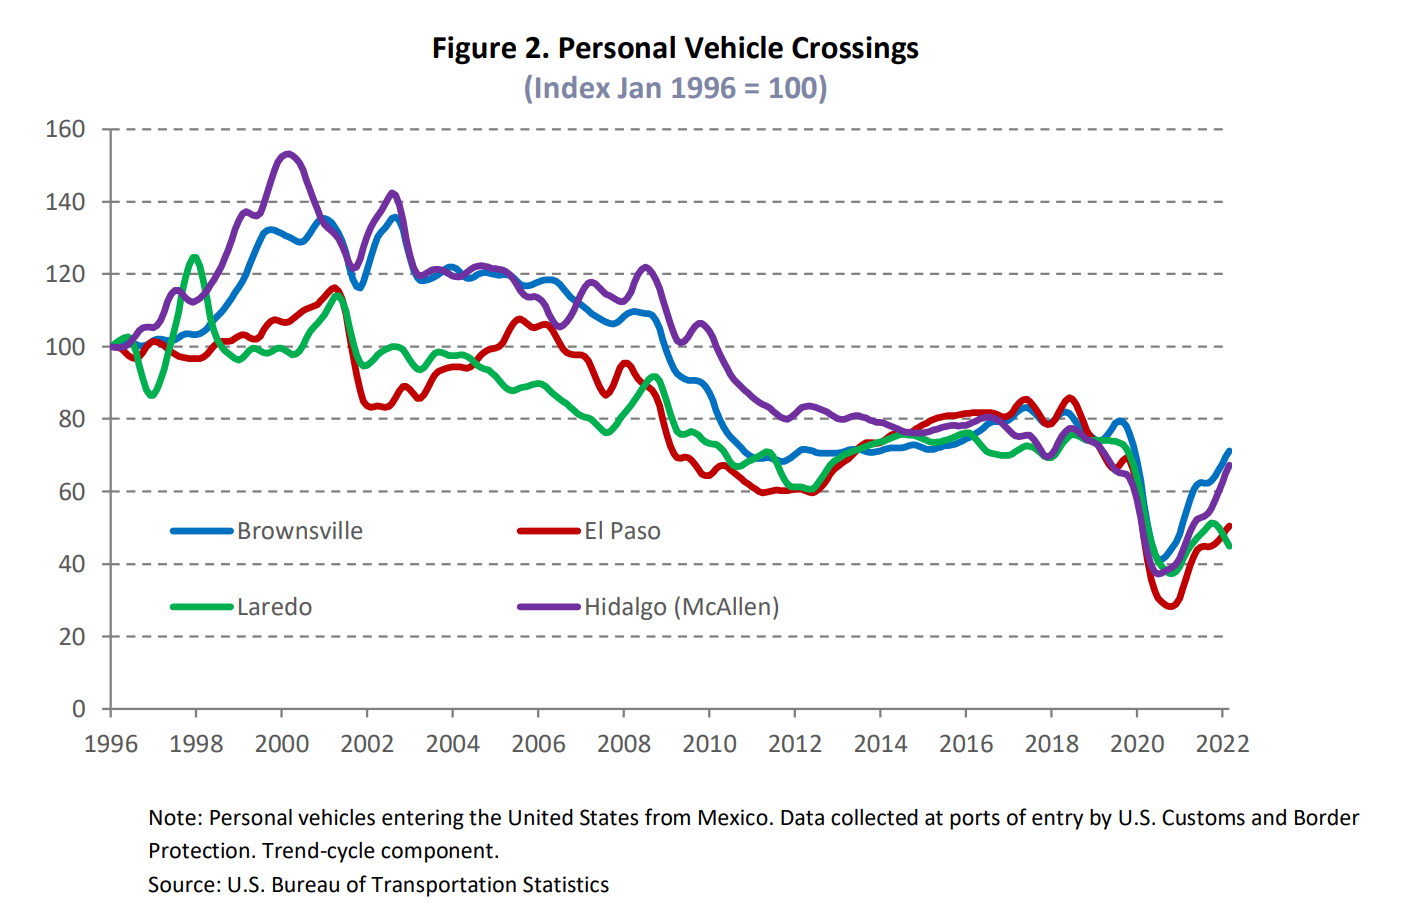
The economy continued its growth, as indicated by the Dallas Fed’s Business-Cycle Indexes. The metric in McAllen accelerated 3.4 percent on a seasonally adjusted annualized rate (SAAR) amid solid payroll expansions. El Paso’s index elevated 3.9 percent while Brownsville and Laredo’s indexes increased by 4.3 and 5.2 percent, respectively. Pedestrian and personal-vehicle crossings grew by 39.7 and 45 percent above year-ago levels, respectively (Figures 1 and 2), as the Department of Homeland Security revised its policy to allow noncitizens who are fully vaccinated and have appropriate documents to travel through borders in early November 2021.
Overall, border nonfarm employment added 4,900 jobs in first quarter 2022, resulting in 0.6 percent growth. Laredo added 800 positions, led by gains in government and transportation. El Paso rebounded, adding 1,300 jobs, many of which were created in trade and hospitality sectors. Meanwhile, in the Rio Grande Valley, Brownsville and McAllen added 800 and 2,000 jobs, respectively. The major sectors contributing to the employment growth were trade, transportation, healthcare, education, and government.
On the southern side of the border, Mexican manufacturing and maquiladora employment1 increased by 15,403 jobs in February. Reynosa’s employment increased by 1.7 percent and Juarez’s increased by 3.2 percent month over month (MOM), respectively, adding 2,350 workers in the former and 9,482 in the latter in February. On the other hand, maquiladora employment in Matamoros and Nuevo Laredo accelerated by 3.2 percent and decreased by 0.7 percent MOM, respectively, adding 1,988 workers in the former and laying off 209 workers in the latter. On the U.S. side of the border, vehicle manufacturing continued declining due to supply chain issues in procuring semiconductor chips.
1Mexican manufacturing and maquiladora employment is generated by the Nacional de Estadística y Geografía.
The IHS Markit Mexico Manufacturing PMI for March reported further deterioration in the overall confidence of Mexican manufacturing primarily due to inflation concerns, raw material scarcity, and the war in Ukraine. The war has led to an increase in energy, oil, and gasoline prices in border areas.
The average unemployment rate fell to 6.3 percent in the border metros in the first quarter. Joblessness fell to 5.1 percent and 5.2 percent in El Paso and Laredo, respectively, while the metrics for the Rio Grande Valley fell to 8.1 percent and 7 percent in McAllen and Brownsville, respectively. The labor force participation rate ticked up, while the number of weekly initial unemployment claims across border areas in the first quarter compared to the fourth quarter (Figure 3).

Fluctuations in the average private hourly earnings revealed negative real wage growth along the border except in El Paso and Laredo. Some of the downward pressure may be due to the recovery of lower paying jobs that bore the brunt of COVID-19-related layoffs, pulling the average wage down. Moreover, inflationary pressures prevented meaningful gains in purchasing power. Earnings in McAllen fell 2.64 percent quarter over quarter (QOQ) in real terms to an average nominal wage of $19.31. Hourly wages in Brownsville ($17.56) also trended downward, decreasing by 0.9 percent on average, while El Paso (21.01) and Laredo (19.07) reported an increase of 0.12 percent and 4.12 percent QOQ. While baseline effects are mechanically weighed on year over year (YOY) numbers, nominal wages are approaching pre-pandemic levels along the border.
Total construction values decelerated during the first quarter, decreasing 5.5 percent. Residential values increased drastically and nonresidential values fell after consecutive growth in the last three quarters. Similar trends continued in El Paso. On the nonresidential side, values increased in Laredo. Brownsville reported an increase in both residential and nonresidential construction values in the first quarter.
In the currency market, the peso per dollar exchange rate dropped to $20.54, but the inflation-adjusted rate2 decreased 4.3 percent YOY and 0.6 percent MOM, revealing gains for Mexican importers. Despite ongoing hostility in eastern Europe and continued supply-chain bottlenecks, total trade values increased by 8 percent along the border during the first quarter. At the metropolitan level, imports grew by 7.8 percent due to expanding trade activities in the Rio Grande Valley and Laredo, rising 5.2 and 8.6 percent, respectively. The metric fell for El Paso by 8.5 percent. Export values increased 7.8 percent along the border with Laredo and McAllen increasing by 12.9 and 4.4 percent, respectively. Export values decelerated by 9.9 percent in Brownsville and 1.6 percent in El Paso, while the metric rebounded in the overall border area. The border’s trade sector remains an integral component of the local economies. Ongoing supply-chain disruptions uniquely affected El Paso as its international commerce is largely dependent on products that contain semiconductors.
2 The real peso per dollar exchange rate is inflation adjusted using the Texas Trade-Weighted Value of the Dollar. Its release typically lags the Texas Border Economy by one month.
Housing
Border housing sales reported 4.2 percent growth in the first quarter, while inventory constraints and reduced housing affordability persisted. The Rio Grande Valley reported mixed sales growth as McAllen continued its impressive growth from the last two quarters and posted an 18.3 percent increase in housing sales. Sales in Brownsville declined 6 percent during the first quarter. Sales activity in El Paso increased slightly while Laredo’s metric fell 4.8 percent in the first quarter.
The border metros issued 2,750 single-family housing construction permits, increasing 18 percent, due to a significant rise in new permits issued in the Rio Grande Valley, where Brownsville and McAllen reported 81.2 and 8.5 percent increases, respectively, over the last quarter. Brownsville reported exponential growth in new permits as it is emerging as a new investment opportunity due to its location, which provides strategic access to U.S. and Latin American markets. The positive trend persisted along the border metros as the issuance of new permits rose 9.4 percent for El Paso and 11.2 percent for Laredo. On the other hand, a similar trend continued for the Rio Grande Valley’s private single-family construction values as Brownsville and McAllen’s values rose by 40.2 and 9.1 percent, respectively, during the first quarter. El Paso and Laredo posted declines in QOQ growth in values from the last two quarters. While construction values corroborated positive levels of the current supply-side activity, the dearth of permits suggests long-term supply challenges.
While a balanced housing market typically has a months of inventory (MOI) closer to six months, the MOI along the border remained much lower than this benchmark. Laredo’s growing sales activity and a downtick in new listings pushed the average MOI for the first quarter down to 1.7 months. El Paso’s metric decreased to less than a month, McAllen’s metric fell to two months, and Brownsville’s remained at 1.6 months. This indicated inventory levels are declining and ongoing construction needs to be completed at a rapid pace.
The average number of days on market (DOM) along the border varied compared with year-ago levels. The average metric remained exceptionally low in the first quarter. El Paso’s DOM remained at 43 days, while McAllen’s rose to 49 days. Laredo’s DOM increased to 42 days, while listings in Brownsville averaged nearly two months on the market.
Compositional changes contributed to growth in the median home price along the border metros as tight inventories at the lower end of the market pushed activity into higher price cohorts. El Paso’s metric was at an all-time high of $229,419. Brownsville’s decreased to $237,825. McAllen’s median home price increased to $216,024 after falling earlier in the first quarter, while Laredo’s decreased from an all-time high of $233,607 to $207,488.
While home prices have increased considerably since the start of the pandemic, so have incomes. For border metros, the income growth has offset some affordability concerns. Affordability improved during the latest quarter, according to the Texas Real Estate Research Center’s Texas Home Affordability Index (THAI). A ratio of 1.00 means the median family income (MFI) is exactly sufficient to purchase the median priced home. A THAI above 1.00 means the MFI exceeds the required income to purchase a median priced home. The index for Laredo increased substantially to 1.82, which means the typical household had 182 percent of the income necessary to purchase the median-priced home in Laredo. The McAllen and El Paso indexes increased substantially to 1.42 and 1.55, respectively. The metric for Brownsville increased to 1.27 after a three-quarter consecutive decline. This uptrend across the border improved the housing affordability advantage that has made the region more attractive than other parts of the state. While incomes have improved, the rise in mortgage rates will likely have a considerable negative impact in the upcoming quarters.