Texas Border Economy | September 2022
Economic indicators along the border showed mixed responses for September.

Texas Border Economy is a summary of important economic indicators that help discern trends in the housing markets along the Texas-Mexico border.

Economic indicators along the border showed mixed responses for September. The payrolls in two out of four border Metropolitan Statistical Areas (MSAs) increased, resulting in a decrease in unemployment rates. Construction activity, however, slowed, creating pressure in border housing markets. The reduction in trade activities led to an increase in the persistent trade deficit.
Seasonally adjusted existing-home sales increased slightly after a continuous decline in the last two quarters. The domino effect of plunging home sales in past months has led to a rise in days on market and inventory, although median home prices still increased in September. The global impact of the war in Ukraine is disrupting energy markets and impacting the cost of living and purchasing power. Despite the Federal Reserve’s efforts, inflation was higher than expected even after slightly declining in August.
Economy
The Dallas Fed’s Business-Cycle Indexes indicated moderate growth, though it was slower than last year when the border was recovering from COVID-19-related shutdowns. McAllen’s metric grew at an annualized rate of 3.9 percent while El Paso’s index decreased by 3 percent. Similarly, Brownsville’s and Laredo’s indexes grew at 5.2 and 6.5 percent, respectively. Pedestrian and personal vehicle crossings were up 30 and 31 percent, respectively, over year-ago levels after restrictions were lifted in 4Q2021.
Overall, border nonfarm employment lost 1,000 positions due to major job losses in both El Paso (1,900) and Brownsville-Harlingen (300). Meanwhile, McAllen and Laredo each added 600 positions. Sectors like trade, transportation, manufacturing, and hospitality are major contributors to employment in the border region.
The spike in jobs led to the lowest unemployment numbers since the onset of COVID-19. The average unemployment rate in the border region fell to 5.7 percent in September. Joblessness in Laredo and El Paso was below 5 percent, and it fell to 7.3 and 6.3 percent in McAllen and Brownsville, respectively. The labor force participation rate ticked down statewide, while weekly unemployment claims declined across border areas.
Fluctuations in the average private hourly earnings revealed growth along the border. Wages rose in all metros, but inflationary pressures prevented meaningful gains in purchasing power. Earnings in McAllen went up in real terms to a nominal wage of $19.43. In Brownsville, wages remained at $17.80. Hourly wages in Laredo and El Paso reached all-time highs at $19.71 and $22.77, respectively, in September. Nominal wages grew significantly in the first half of the year and are approaching pre-pandemic levels.
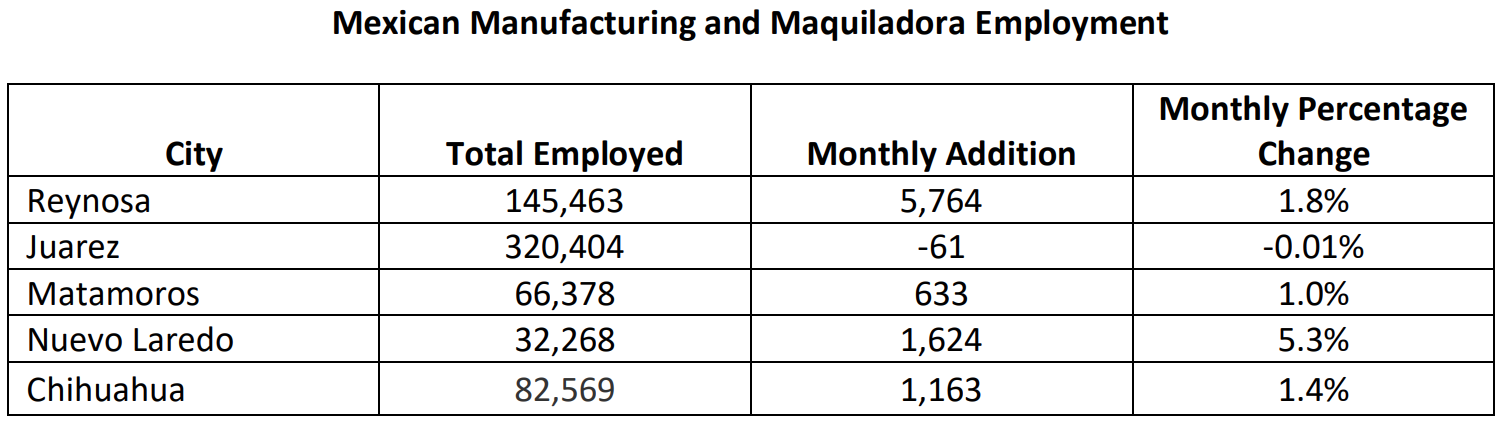
On the southern side of the border, Mexican manufacturing and maquiladora employment1 recovered in August after dipping the month prior with the addition of 9,123 jobs. Job recovery in Mexican manufacturing was driven by growth in Reynosa and Nuevo Laredo (see table).
1Mexican manufacturing and maquiladora employment is generated by the Nacional de Estadística y Geografía.
Global supply chain pressures decreased in September, marking a fifth consecutive month of easing as indicated by the Federal Reserve’s Global Supply Chain Pressure Index. Supply chain pressures were significantly below year-ago levels and are expected to decline further.
The S&P Global Mexico Manufacturing PMI for September indicated persistent contractions in the Mexican manufacturing sector due to ongoing sales declines and cash-flow concerns. According to S&P analysts, some tentative positives included business sentiment and employment due to the upcoming World Cup season. Input costs and output charges increased at softer rates, while an improvement in business confidence supported the hiring of temporary staff.
In the currency market, the peso per dollar exchange rate averaged $19.562. After adjusting for inflation, the metric decreased over the month, revealing gains for Mexican importers and U.S exporters. The total trade value decreased, and the widening gap between imports and exports in September resulted in an increase in the persistent trade deficit. At the metropolitan level, total exports fell by 4.5 percent due to deteriorating trade activities in El Paso and McAllen, and total imports fell by 1.7 percent.
2 The real peso per dollar exchange rate is inflation adjusted using the Texas Trade-Weighted Value of the Dollar.
Housing
Overall construction activity remained sluggish in September due to declining activity in retail, office, and housing sectors. Changes in construction values varied across border areas. New retail, office, and school projects boosted commercial construction values in El Paso while values declined in Laredo. In the Rio Grande Valley, Brownsville reported an improvement in commercial construction activity while McAllen’s metric fell after showing signs of recovery in the last two months.
Overall housing sales reported trivial growth with mixed responses at the metropolitan level. Seasonally adjusted sales were down in Brownsville and McAllen, falling by 11.7 and 8 percent, respectively. Meanwhile, El Paso’s metric rose by 4.8 percent and Laredo’s by 1.8 percent after significant dips in July. Housing sales depend on mortgage rates, and Freddie Mac’s 30-year fixed rate was 6.11 percent in September, the highest in the last decade and up from a record-low 2.7 percent in January 2021. There has been a change in consumer’s buying behavior in the last few months with concerns about rising mortgage rates and inflation.
Border metros issued 694 single-family housing construction permits, down by 3.1 percent from August. The continued reduction in the issuance of new projects in border metros will impact the region’s housing markets. Total private single-family construction continued to decline, falling 9.7 percent month over month in the border area. Values decreased by 4.4 percent in El Paso. Construction activity declined in the Rio Grande Valley, falling 11.3 percent in McAllen and 12.4 percent in Brownsville. Despite declines in permit counts and values, the average value per permit remains elevated compared with pre-pandemic conditions.
Declining sales in recent months have led to a rise in months of inventory (MOI) along the border, though the metric remained much lower than the typical six-month MOI benchmark. Brownsville’s average MOI for September rose to 2.5 months. El Paso’s metric rose to 1.86 months, McAllen’s metric increased to 3.55 months, and Brownsville’s inventory stabilized at 3.14 months. These increases indicate inventory is growing primarily due to a decrease in home sales and an increase in listings.
The average number of days on market (DOM) for September also increased across the border because of stalled housing demand. However, the metric remained exceptionally low compared with year-ago levels. McAllen’s DOM reached 55 days, up from 50 days in August. Laredo’s DOM remained at 32 days, while new listings in Brownsville and El Paso pushed the metric toward two months.
Reduced demand dented the median home price across border regions in the last couple of months, but the metric increased in September. McAllen’s median home price reached $230,000 after a slight decrease in the beginning of the third quarter, while Brownsville’s home prices stabilized at around $246,000. El Paso’s median home price was around $247,500, reporting a significant increase. Contrary to other border metros, Laredo’s median price decreased from $230,500 in August to $220,400 in September. The border region’s housing market is known for its affordability, a factor that has attracted many buyers from other areas.
Mortgage rates play a pivotal role in determining housing prices and sales, and they will influence the border region’s future home price stability.


