Texas Land Market Developments — 2013
2013 Texas land prices continued to climb for most areas. Smaller acreage transactions dominated the market. This report contains Regions 1–7 index prices of large property rural land from 1966 through 2013.

2013 Texas Land Prices
Texas land markets across the state posted strong price increases in 2013. In contrast, the Panhandle and South Plains regions finished the year with a decrease of 0.4 percent from 2012 prices. However, the 2013 regional size-adjusted price per acre represents a 46 percent gain over 2010 price levels. Overall, 2013 statewide size-adjusted land prices increased 9.48 percent over 2012 prices.
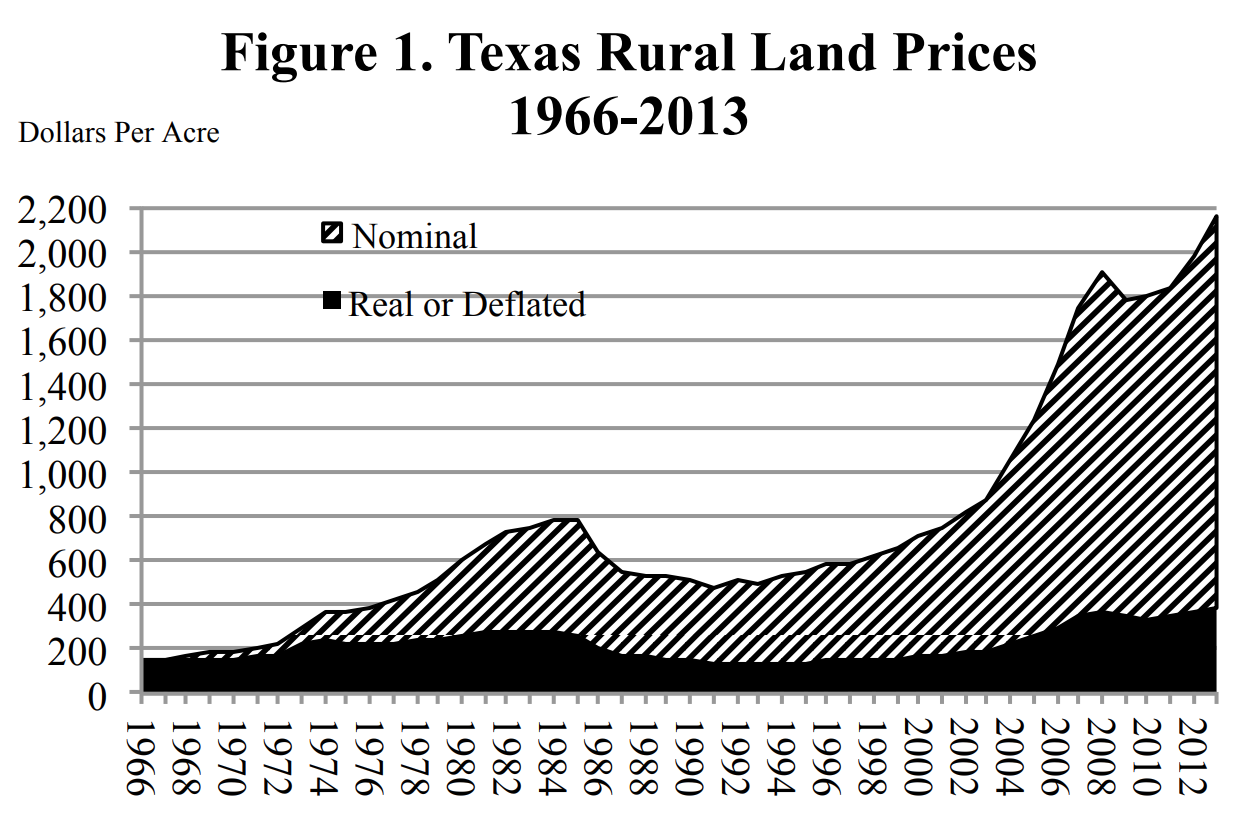
The statewide size-adjusted price of $2,160 per acre compared with the 2012 year-end price of $1,973 per acre shows a strong overall increase for 2013 markets, well above the 5.8 percent 48-year average annual increase.
The real or inflation-adjusted price of $391 per acre in 1966 dollars eclipsed the 2008 record level of $369 per acre by a sizable margin. The 2013 real price represents a 8.01 percent rise over the 2012 annual deflated price, the highest real price level in the past 48 years. Nominal prices shown in Figure 1 and Table 1 reflect the actual prices paid while real prices represent the nominal prices adjusted for inflation to 1966 dollars.
Texas Tract Size
Small transactions continued to dominate in the 2013 market with a median size of 120 acres, much smaller than the 2012 160-acre size and well below the 160-acre long-term norm (Figure 2). That drop in size results largely because of an influx of data from added information sources.

Texas Volume of Sales
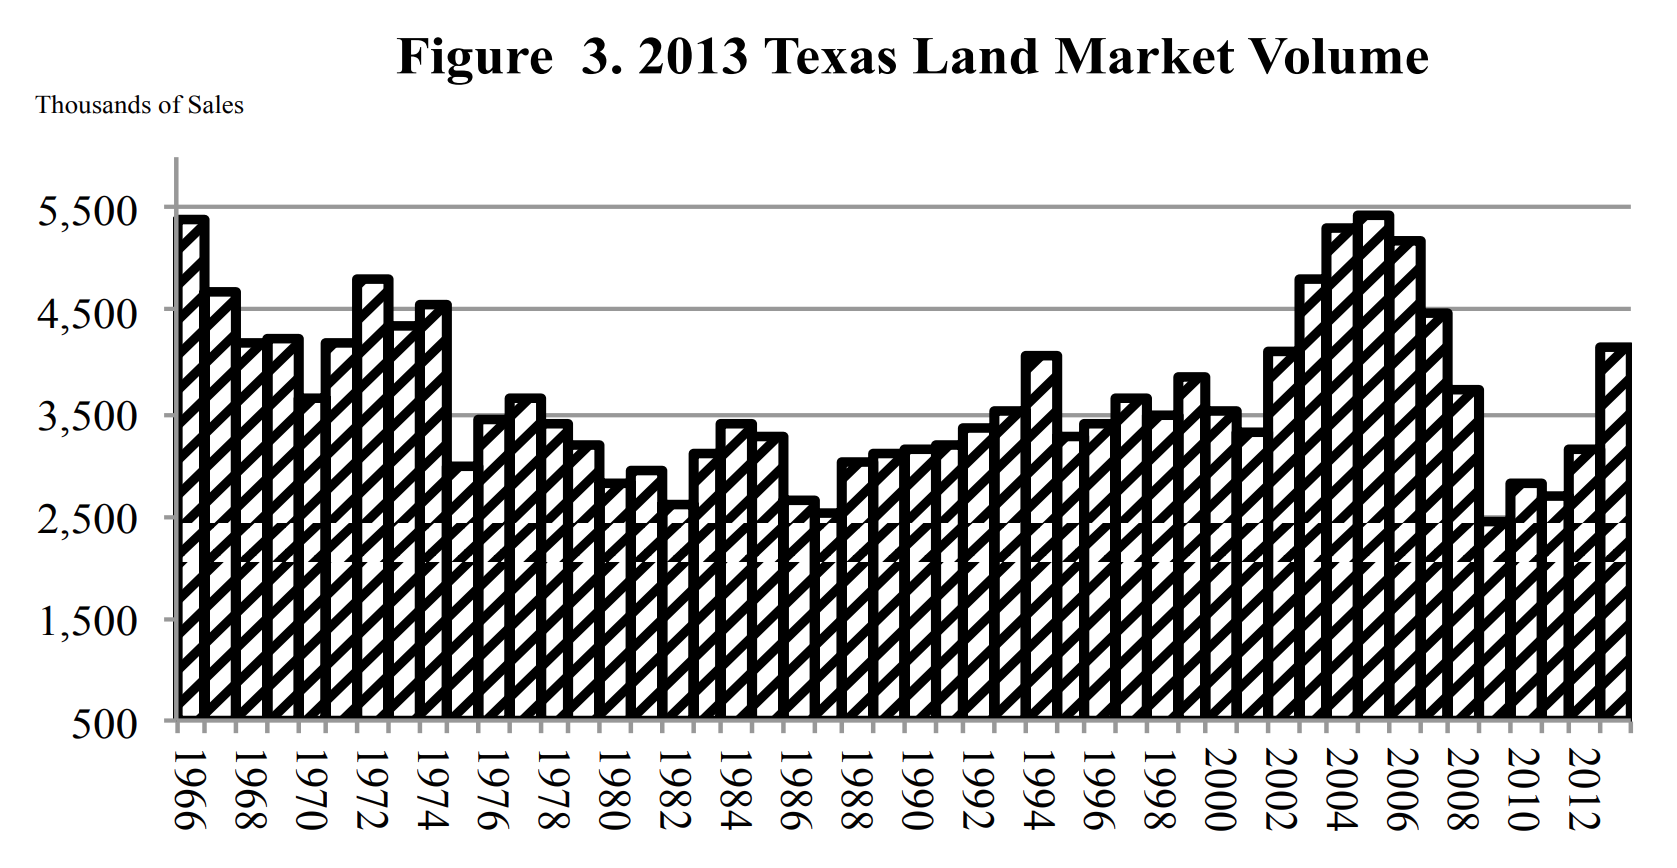
For 2013, a total of 4,135 sales were reported (Figure 3). That sales volume outpaces the 48-year average of 3,664 sales per year. The higher volume of activity reflects both the brisk level of activity reported by observers and the added volume of information included in the data.
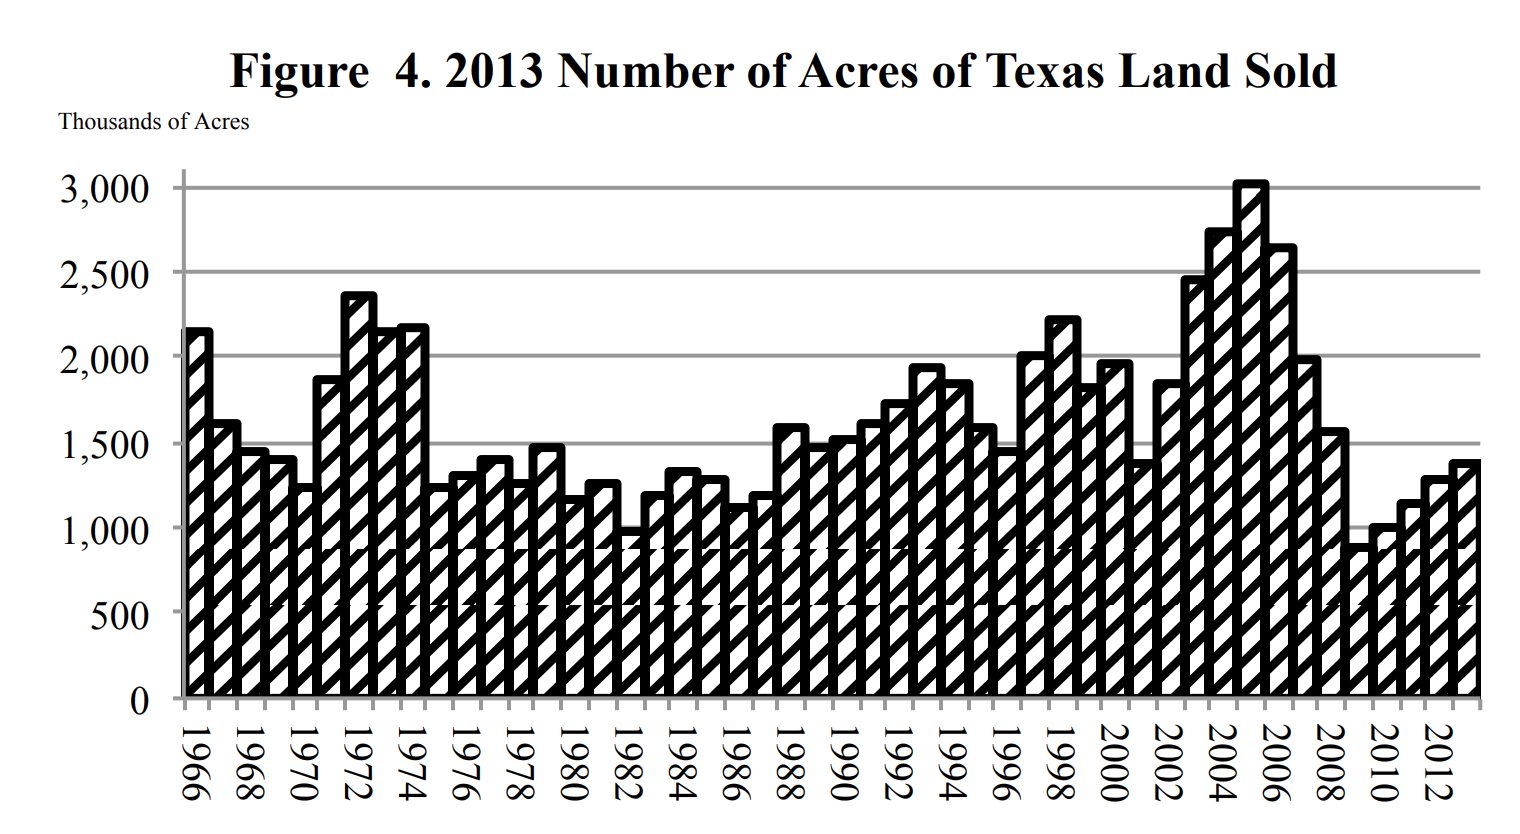
The boost in total transactions also increased the number of acres sold in 2013. As Figure 4 shows, the total number of acres transferred in the 4,135 sales approached 1970s and 1980s levels. The 1,364,476 acres sold in 2013 surpassed the 1,289,161 acres sold in 2021. However that amount continued to fall short of the 2004–06 total acreages. This result suggests that current markets have begun to see more activity than in the recent past.
Regional Land Markets

On the mend since the pullback in 2009, regional price trends shifted into high gear across a broad spectrum with price increases dominating in most locales. Except for the Panhandle and High Plains (Region 1), Texas land markets registered rising prices across the board. Region 1 prices were nearly unchanged in 2013 with weakness in the far northern Panhandle and the South Plains surrounding Lubbock. In contrast, the central Panhandle and Northern Rolling Plains posted strong price increases. The disappointing results followed from a fourth quarter with retreating commodity prices causing some farmland investors to pause in their four-year-old frenzied quest to buy land.
Region 1 — Panhandle and South Plains
Driven by the scramble to acquire farmland investments, buyers pushed prices higher across the board early in the year. However, as commodity prices drifted lower toward the end of the year, evidence of some cooling emerged as the regionwide price settled in at $1,076 per acre in 2013, virtually unchanged from the 2012 price of $1,080 per acre.
Region 2 — Far West Texas
The vast area of Region 2 yielded few reported sales, ensuring sizable swings in price from one year to another. In 2013, reported prices reached $572 per acre for a 53 percent rise above the $374 per-acre price in 2012.
Region 3 — West Texas
After a lackluster 2012, the West Texas region saw prices rise a substantial 17 percent to $1,266 per acre in 2013. The continuing appetite for cropland as well as an active market in large livestock operations fueled this robust price increase.
Region 4 — Northeast Texas
Hard hit by the recession in Dallas-Fort Worth, this region struggled to sustain the rising land prices posted from 2009 through 2011. However, prices moved up in 2012 and continued to climb in 2013 to $2,838 per acre, a 5 percent increase over 2012 prices. This improving market situation reflected returning prosperity in the urban areas dominating the region.
Region 5 — Gulf Coast – Brazos Bottom
The thriving oil patch pumped resources into this region, running prices up 17 percent to $4,875 per acre. Robust growth in Houston radiated throughout the area, boosting land prices in anticipation of a rebounding housing market.
Region 6 — South Texas
Encompassing the South Texas Eagle Ford shale play, this region saw the price increases that began in 2012 continue with a 5 percent increase to $2,941 per acre in 2013. The economic activity surrounding development of the Eagle Ford drove prices higher in this region.
Region 7 — Austin – Waco – Hill Country
This region followed up a strong price increase in 2012 with another robust 6 percent increase to $2,969 per acre in 2013. The continuing recovery in urban areas as well, as prosperity based in the Eagle Ford shale in South Texas fueled demand in this market.
Future Trends
At the beginning of 2014, many observers forecast robust economic performance ahead. Despite some troubling developments in the spring (disappointing retail sales, a drop in pending home closings, etc.) activity rebounded strongly and the consensus continues to see 2014 as a prosperous year. That expansion likely will drive market activity and prices higher throughout the year.
Two potentially troubling situations could threaten this optimistic outlook. The drought strangling much of the nation continues to plague some areas of Texas. Much of Texas remains abnormally dry with exceptional drought strangling some areas. Lack of moisture could hamper land market recovery. In addition, the lofty levels of cropland prices appear in many minds to be unsustainable. Cropland market observers see evidence of pullback in demand for investment land in the Midwest. However, cropland prices remain strong as buyers that were formerly shut out in the bidding for land now have an opportunity to buy.


