


Considering both the North American Industrial Classification System industry data and the Standard Occupational Classification occupation data is key to understanding Texas’ industrial real estate job markets.
Sep 25, 2023
What’s My Line?
Two Approaches to Classifying Jobs
Ask any market analyst and they’ll tell you there’s more than one way to count a job. This article gives you two, and together they provide a more complete understanding of Texas’ industrial job markets.

Employment is an important driver of real estate demand. Market analysts track jobs to understand current market conditions and forecasts future activity.
The most commonly used employment metrics are based on industrial classification. All workers in the U.S. can be classified by the industries in which they work. Firms that use similar production methods are grouped into industrial sectors, and all their employees are counted in their respective industry. Employment by industry classifies workers based on the industry in which they do their work, regardless of the type of work they do. Two examples of industrial sectors include finance and insurance, and manufacturing.
Another way of classifying employment is by occupation. This approach classifies workers based on the job they do, regardless of which industry they are in. For example, an accountant is classified by occupation as a business and financial operations worker. That accountant might work for a bank, where she would be counted as a finance and insurance industry employee, or that accountant might work for a food processor and be classified as a manufacturing worker.
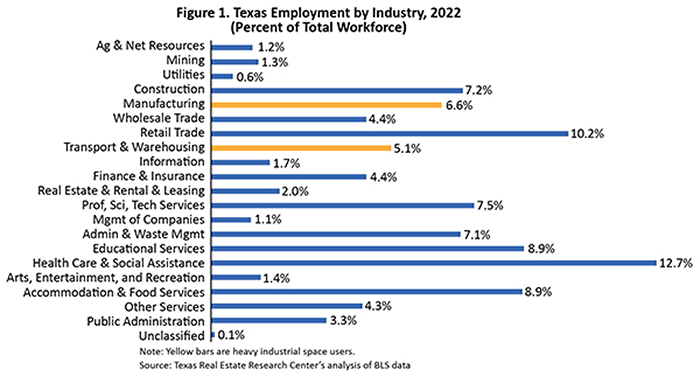
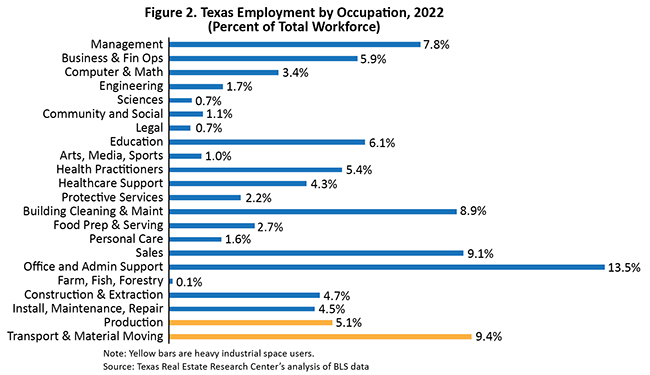
The U.S. Bureau of Labor Statistics (BLS) conducts separate surveys to collect both the industry and occupational employment measures. Figures 1 and 2 summarize Texas employment by the highest-level categories in each of these systems. The analysis that follows presents the different perspectives each employment system can bring to industrial real estate market analysis. Three key findings emerge:
- Different ways of measuring employment can lead to different assessments of industrial markets. Measuring employment by industry may overstate the actual amount of factory or warehouse space needed.
- Occupational measures of employment may do a better job explaining the demand for industrial space, because they isolate factory and warehouse floor jobs from overhead and administrative jobs that may be sited in office properties.
- Since 2012, Texas markets have seen mixed performance in terms of growth in production occupations, while all areas of Texas have seen great gains in transportation and material-moving occupations.
Classifying workers by occupation rather than industry offers some advantages, but both systems have pluses and minuses. A thorough market analysis will use both.
Industry employment is timelier, being tallied monthly, while occupational employment is only measured annually. The sampling used in industry employment gives more reliable total job estimates, but occupation employment gives more details at the local level for individual metropolitan and rural areas. Finally, if wage data are of interest, occupational employment data include details on mean, median, and various market percentiles, revealing a picture of the distribution of wages across markets.

Manufacturing, and transportation and warehousing industrial sectors (Figure 1) and production, and transportation and material-moving occupation groups (Figure 2) each use a lot of industrial real estate and are, therefore, key categories for tracking industrial real estate markets. A total of 11.7 percent of employment measured by North American Industrial Classification System (NAICS) industry sector falls into the two industrial-using categories. A total of 14.5 percent of employment falls into the two major Standard Occupational Classification (SOC) occupation groups that are heavy users of industrial space (see sidebar for a brief explanation of the NAICS and SOC).
Measuring Industrial Real Estate Using Employment
The BLS publishes occupational details within each major NAICS industrial sector. Table 1 breaks down these details—at both the state and national levels—for the two industrial sectors most associated with industrial space. This allows one to compare one industry’s employment structure with the other and to compare the Texas industry with the corresponding one nationally. These data have two notable features.

First, a large share of each industry includes jobs typically found in an office setting rather than a factory or warehouse setting. About two-thirds of transportation and warehousing employment and only about half of manufacturing employment involve tasks that require shop floor real estate (such as factories and warehouses). The remainder in each industry includes workers that may be sited in office space (onsite or at another location).
Second, these industries in Texas employ a smaller share of their workforce in the industry’s “core” occupations. Nationally, 49 percent of manufacturing employees are in production occupations compared with 45 percent in Texas. Likewise, for transportation and warehousing firms, nationally 67 percent are in transportation and material moving occupations. In Texas, the share is 63 percent. This implies industry in Texas may consume relatively less factory or warehouse space than the industry nationally. Using industrial (that is, NAICS employment) to estimate demand for industrial space may overstate the actual demand for true warehouse or factory space.
Industrial space-using occupations are found in more than these two industries. Table 2 shows the top five NAICS industries that employ these types of workers in Texas. As expected, production workers are heavily concentrated in manufacturing industries. In Texas, 62 percent of production occupations work in those industries. The second-largest concentration of production workers is in the administrative and waste management industry (7 percent). This results from staffing agencies that supply many production workers to manufacturing firms. Production occupations are sometimes found in unexpected sectors, such as wholesale, retail, and even construction. This reflects final assembly operations in goods distribution and construction job site work, among other factors.

Transportation and material moving workers are less concentrated. The actual transportation industry employs only 33 percent of these workers. Other important industrial sectors for these occupations are retail (20 percent), wholesale trade (12 percent), and, yet again, the administrative and waste support industry (9 percent). That these types of workers are found in a variety of industries is less surprising than the case of production workers given the commonality of warehouse space in many businesses.
Changes in Industry and Occupational Employment 2012 to 2022
The implications of employment analysis for industrial market analysis can be seen by examining the differences in growth rates in terms of industries and occupations. Table 3 compares job growth nationally and in Texas for key industrial space-related industries and occupations.

Over the ten years ending in 2022, manufacturing industries nationally grew their employment 6.1 percent. This exceeded the growth in manufacturing industries in Texas, which added 5.7 percent to their employment. Texas’ slower growth is partly because of declines in oil and petrochemical industries after 2016. In the transportation and warehousing industries, the national employment growth was robust at 37.6 percent. Texas firms in these industries grew even faster at 46.1 percent.
Turning to changes in occupational employment, production jobs barely grew nationally and in Texas. U.S. production employment increased by 1.7 percent, Texas by 1.5 percent. Of the few jobs manufacturing sectors added, most were off the factory floor. For occupations involved with transportation and material moving, growth was strong both nationally and in Texas. The workforce in these occupations grew by 54.6 percent nationally and by 67.6 percent in Texas. Job growth has been strong by industry and occupation in categories that deal with moving goods.
Alternative Employment Measures and Demand for Industrial Space
These differences in employment performance have implications for understanding the demand for industrial space. Comparing changes in each employment measure to two key industrial market metrics—change in inventory and cumulative net absorption—yields the correlations shown in Table 4.

In these cases, occupational employment is more highly correlated with these measures of industrial demand than industrial employment. For instance, the change in cumulative net absorption across Texas has a 92.9 percent correlation with the change in industrial employment over the same period. The correlation of net absorption with occupation employment is 97.3 percent.
Occupational employment’s better fit is likely because of those industries in which many workers, as noted earlier, do not use factory or warehouse space. These overhead or administrative workers may be housed in separate office buildings.
While these preliminary results need further scrutiny, they hint that only using NAICS industrial employment to track industrial markets may not be ideal. Occupational trends are also important.
Metropolitan Area Performance
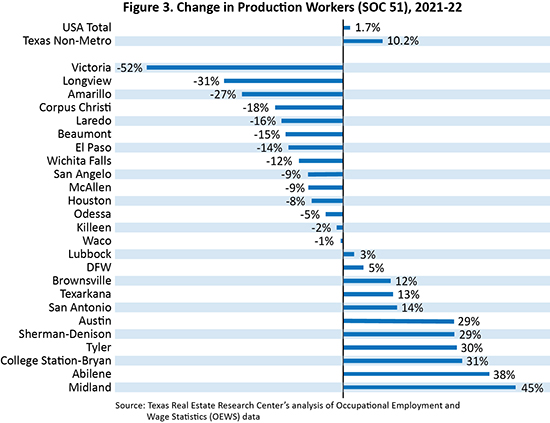
Using occupational employment can highlight trends across Texas metro areas. Growth in industrial inventory has not been uniform across the state over the last decade. The rate of growth in production workers varied greatly between MSAs from 2012 to 2022 (Figure 3). Nine metro areas saw double-digit growth: Midland, Abilene, College Station-Bryan, Tyler, Sherman-Denison, Austin, San Antonio, Texarkana, and Brownsville-Harlingen. Fourteen of the state’s 25 MSAs lost production workers over this interval. Oil-and-gas-focused markets were hit particularly hard.
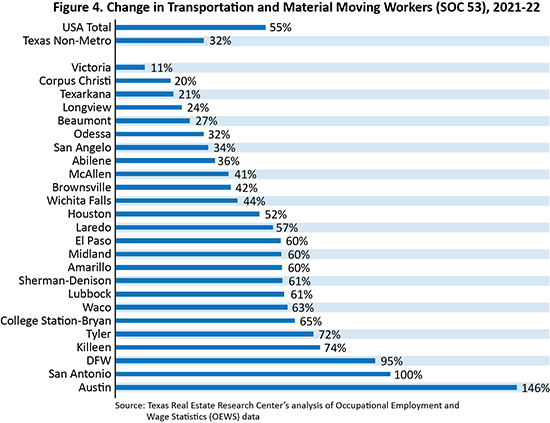
All Texas MSAs, including those in rural areas, saw double-digit growth in transportation and material moving workers (Figure 4). The different results by these two occupation groups have direct impacts on local market supply and demand for industrial space. Historically, production workers require less industrial space than warehouse workers to perform their jobs.
The dramatic growth in transportation and material moving workers largely explains much of the increase in industrial inventory in Texas in recent years. In many Texas markets, the growth in industrial space has been almost completely due to distribution rather than manufacturing.
Implications for Employers Looking at Texas
Logical next steps in this research include examining the data at a finer level of detail.
For instance, the manufacturing sector can be broken down into sub-industries such as food processing or petrochemicals. Likewise, occupational groups such as production workers can be broken down into more specific occupations such as machinists or team assemblers.
The actual mix of workers by occupation has important implications for firms seeking to set up shop in Texas. Some markets will likely be better places to find those workers. Examining the differences across Texas metro areas may better explain why some metro areas grow faster than others.
____________________
Dr. Oney ([email protected]) is research director with the Texas Real Estate Research Center at Texas A&M University.
Did you like this Article?

You might also like


PUBLISHED SINCE 1977
Tierra Grande
Check out the latest issue of our flagship publication.