


Texas Housing Insight
The third quarter ended with an increase inhome sales. Pending sales had a stronger increase,which could mean another positive month in October. Home prices increased slightly, and new listings decreased after stronger growth earlier in the year.

Click here to receive email notifications each time this report is published.

All measurements are calculated using seasonally adjusted data, and percentage changes are calculated month-over-month, unless stated otherwise.

The third quarter ended with an increase in home sales. Pending sales had a stronger increase, which could mean another positive month in October. Home prices increased slightly, and new listings decreased after stronger growth earlier in the year. In the new-home market, both permits and starts dipped in September. Growth was exceptionally strong for both in the spring, but the pace has since leveled out.
Sales Increase, New Listings Dip
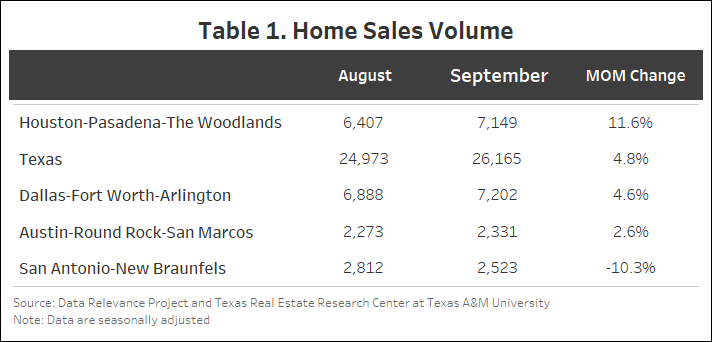
After a dip in August, statewide seasonally adjusted home sales increased by 4.8 percent month over month (MOM), resulting in 26,165 homes sold (Table 1). Houston had the largest increase among the Big Four at 11.6 percent (7,150), followed by Dallas at 4.6 percent (7,202) and Austin at 2.6 percent (2,331). San Antonio was the only one among the Big Four to have a decrease in September (10.3 percent), resulting in 2,523 homes sold.
The number of new listings decreased by 490, marking a 1.1 percent fall from August. After Hurricane Beryl, which hit Texas in early July, new listings in Houston plummeted but bounced back in August. Even without the hurricane, the rate of new listings statewide appears to have slowed down after an aggressive start of the year. San Antonio saw an increase of 2 percent (4,104), followed by Austin at 1.2 percent (3,587). Houston and Dallas both decreased by 4 percent each at a current new listing count of 13,412 and 11,002, respectively.
The state’s average days on market (DOM) has remained at 62 days since August. Austin had the largest increase—from 71 to 73 days, a 2.8 percent increase. San Antonio increased from 75 to 76 days. Dallas fell from 55 days to 54 days while Houston remained at 53 days.
Texas’ number of active listings increased from 120,019 to 122,760 (2.3 percent). Active listings across the Big Four had mixed results in September, with Dallas and Houston rising at 4.7 (28,191) and 4.3 percent (29,724), respectively, while Austin fell by 2.7 percent (11,153). San Antonio had no significant changes and increased by only 0.15 percent.
Statewide pending listings have increased from 26,933 to 28,779, which represents 6.9 percent overall. Houston saw a significant increase in pending listings from 7,298 to 8,455 (a 15.8 percent rise), followed by Dallas at 8.2 percent (7,348). San Antonio and Austin had less fluctuation. San Antonio rose by 1 percent (2,702), and Austin fell by 0.5 percent (2,552).
Interest Rates on the Decline
Treasury and mortgage rates both declined in September but at a slower rate than the month before. The average ten-year U.S. Treasury Bondyield fell 15 basis points to 3.72 percent and has consistently been on the downward slope since April of 2024 September saw the lowest rates since June 2023. The Federal Home Loan Mortgage Corporation’s 30-year fixed-rate fell by 32 basis points to 6.18 percent. The Federal Reserve slashed the federal funds rate by 50 basis points and has suggested at least one more rate cut this year.
Single-Family Permits Fall
Statewide, building permits decreased by 1.2 percent MOM in September. Except for San Antonio, which was up 1.2 percent, the Big Four had a downward trend with Dallas falling 5.4 percent (4,021), Austin 3.4 percent, and Houston 1.2 percent.
Single-family construction starts fell after monthly increases since July 2024. Seasonally adjusted statewide single-family starts decreased 2.7 percent MOM to 13,170 units. Most of the Big Four fell in September. Dallas fell the most at 8.8 percent (3,126), followed by Houston at 3.7 percent (4,463) and Austin at 1.6 percent (1,524). San Antonio, meanwhile, increased by 4.1 percent (895).
The state’s total value of single-family starts climbed from $22.77 billion in September 2023 to $28.9 billion in September 2024. Houston accounted for 35.6 percent of the state’s total starts value followed by Dallas with 27 percent.
Home Price Rose Slightly
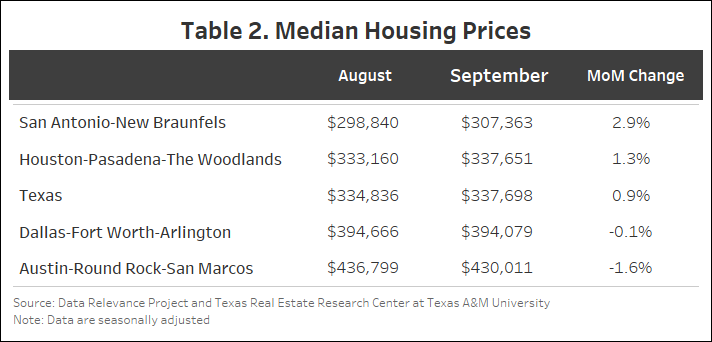
Texas’ median home price rose 0.9 percent MOM in September from $334,836 to $337,698 (Table 2). San Antonio grew by 2.9 percent at $307,363 and Houston by 1.3 percent at $337,651. Austin dipped by 1.6 percent to $430,011 while Dallas fell by only 0.1 percent to 394,079.
The Texas Repeat Sales Home Price Index (Jan 2005=100), which is a more accurate reflection of home price changes, fell 0.4 percent MOM in September but increased 1.7 percent year over year (YOY). Austin’s annual appreciation remains below the state’s average and fell by 0.9 percent YOY in September.
To view this report with additional figures, download the PDF.
To see the previous month’s report, click here. For the report from a year ago, click here.
Previous reports available with data from:
2024: January, February, March, April, May, June, July, August
2023: January, February, March, April, May, June, July, August, September, October, November, December
2022: January, February, March, April, May, June, July, August, September, October, November, December
2021: January, February, March, April, May, June, July, August, September, October, November, December
You might also like


How Natural Disasters Affect Homebuying Decisions

String of Perils
Breaking news: Insurance is complicated. This guide to the different types of perils, policy forms, and coverage types can help you better understand your choices for property coverage and make informed decisions.

TG Magazine
Check out the latest issue of our flagship publication.