Texas’ border location, sea access, natural oil and gas resources, along with favorable labor costs and a friendly business climate have made it the top exporting state in the country and a major world exporter.
Apr 3, 2013
All My Exports Come from Texas
Texas is a major player in the export game. It ranks first among the states in exported goods and 55th in the world. That translates into income and jobs that strengthen the state’s economy.

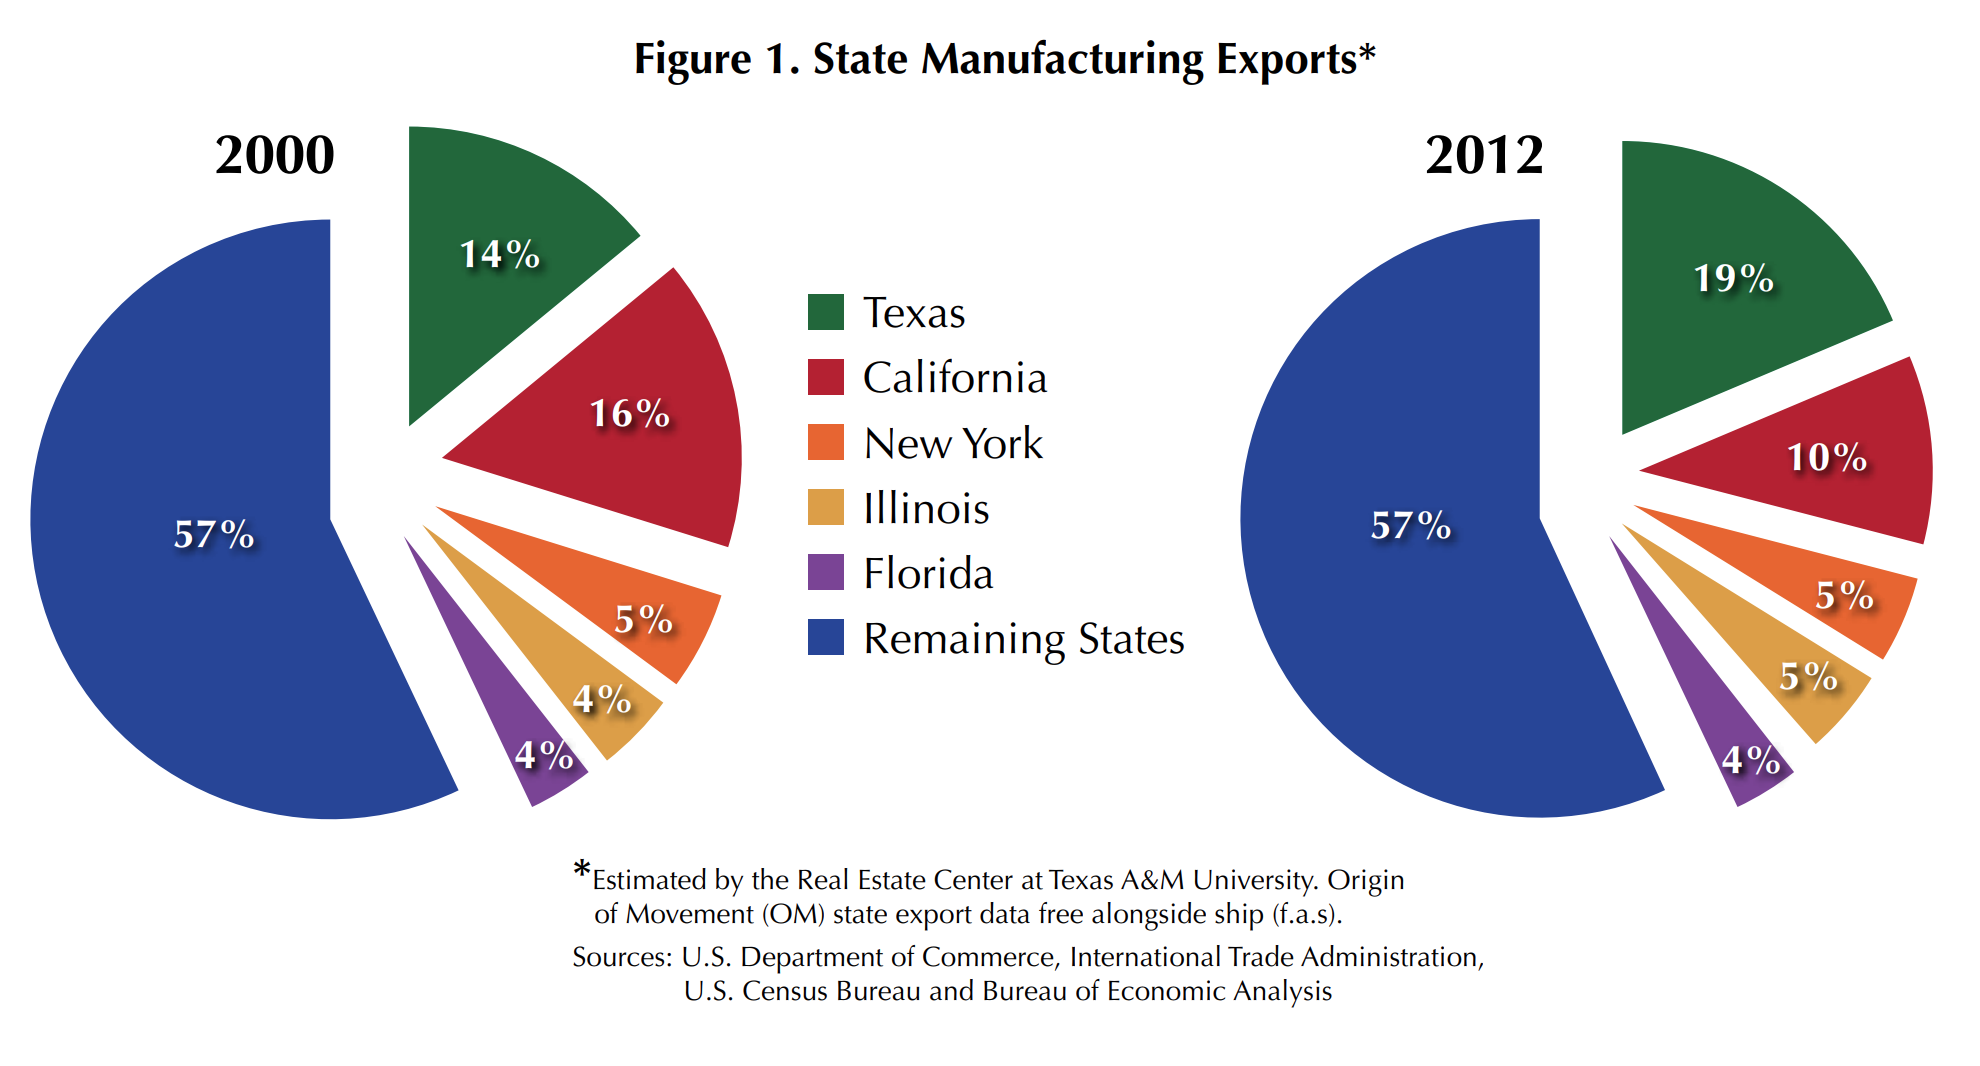
Texas exports more goods than any other U.S. state (Figure 1). Almost two of ten manufactured goods are exported from Texas to world markets. Some of these goods are manufactured in the state. Others are produced out of state and shipped to Texas for consolidation in distribution centers and export. Though these goods are not produced in Texas, they have positive spillover effects for the state’s economy in areas such as transportation and warehousing services, which generate income and jobs for the regional economy.

Texas has taken advantage of its geographical location as a border state with seaports, and its natural oil and gas resources. Its labor and capital endowment and their development have enabled the state to export manufactured technological goods such as computer and electronic products. These factors have contributed to Texas’ success as a world exporter of manufactured goods.
The state is also a major recipient of foreign direct investment (FDI). Firms from around the world have established operations in Texas. This investment creates job opportunities and brings new capital and new technologies that increase productivity and generate higher wages and income for the state’s population.
Small and medium-size firms are the major Texas exporters. In 2010, there were 27,893 exporting firms. Of these, 93.1 percent were small- and medium-size firms with an export value of $51.2 billion, or 35 percent of the state’s merchandise exports. Texas ranks fourth nationally by the number of firms and small-medium exporting firms.
How Much Does Texas Export?
In 2012, Texas exports totaled $265 billion and manufacturing exports $251 billion. In 2011, they represented 19.2 percent and 12.8 percent, respectively, of the state’s gross state product. From 1990 to 2012, Texas exports have increased 7.9 percent on average annually.
Manufacturing exports increased 8.1 percent during the period, an impressive figure considering it includes the 2001 economic recession and the Great Recession of 2008–09. Texas exports were almost 1 percent of world manufacturing exports and ranked in the top 55 versus other countries’ exports in 2009. Texas has more manufacturing exports than Peru, Chile and Norway.
Where Do Texas Exports Go?
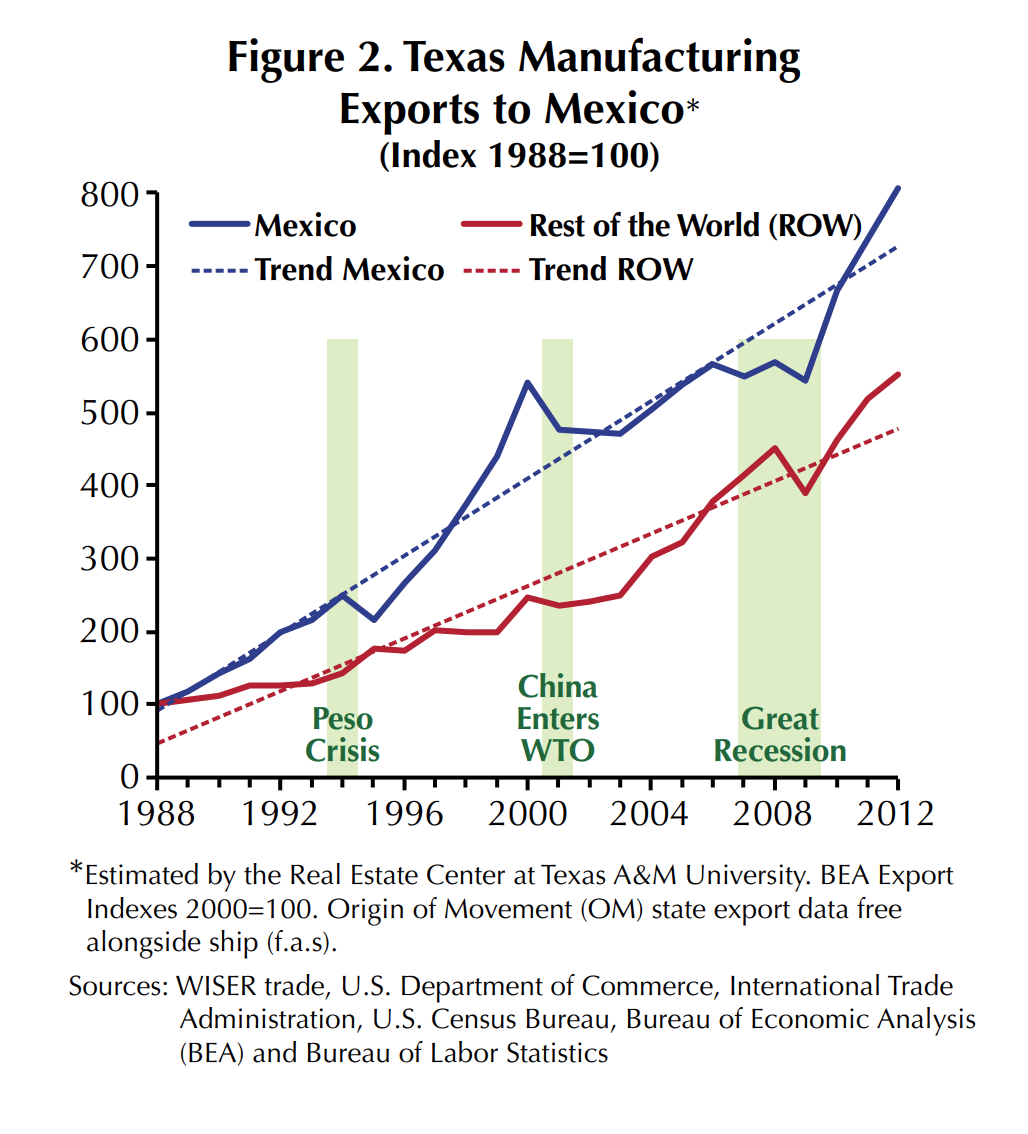
Texas sends manufactured goods to 222 countries. Mexico is Texas’ largest trading partner (Figure 2). Approximately one-third (36 percent) of all manufacturing exports originated in Texas were exported to Mexico in 2012; Canada was a distant second at 9 percent. In recent years, exports to Mexico and Canada have fallen while those to Brazil, the Netherlands and China have increased. Manufacturing exports to Brazil and the Netherlands doubled, while exports to China tripled from 1999 to 2012. This trend has diversified Texas’ export business. The increase in exports to Brazil and China has been a direct result of their recent economic growth, which has increased demand for goods such as chemical and petroleum products.
When comparing Texas export markets with those of the United States, the pattern is slightly different. Canada was the biggest export destination with 19.4 percent of U.S. manufactured exports in 2012; Mexico was second with 14.5 percent.
What Does Texas Export?
The global increase in demand has made petroleum and coal products Texas’ biggest export category. In 2002, it represented only 4 percent of manufactured exports; by 2012, it was 22.8 percent (Figure 3). Demand has been especially strong in emerging markets.
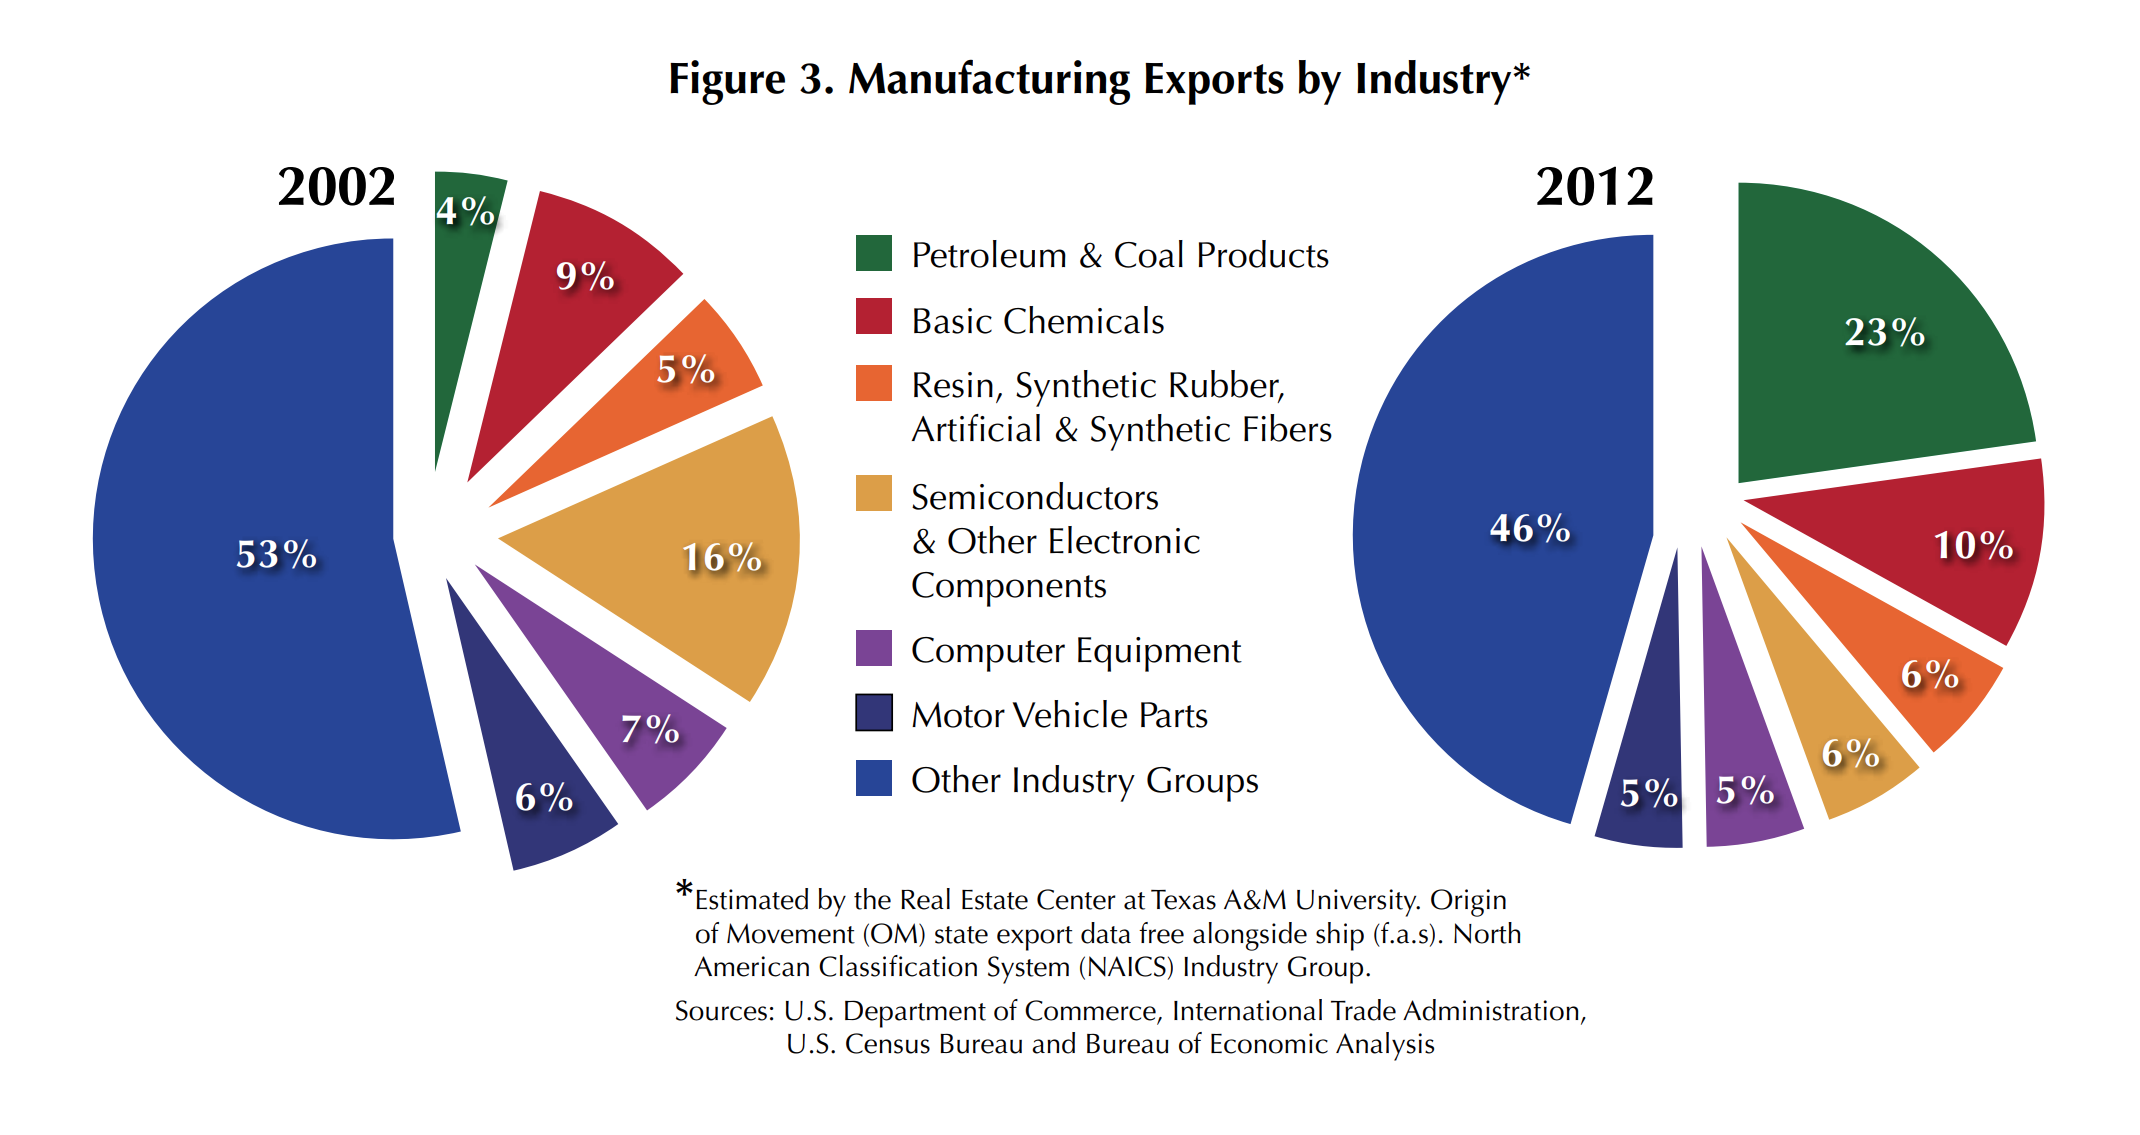
Other exports with increasing shares are basic chemicals, and resin and synthetic rubber/fiber exports, which rose from 9 percent and 5.4 percent, respectively, in 2002 to 10.4 percent and 5.9 percent in 2012 (Figure 3). In contrast, semiconductors and other electronic component shares decreased considerably in the same period, falling from 16 percent to 5.6 percent (Figure 3).
How Much of Texas’ Exports Are Produced In-State?
Origin-of-movement export figures do not reflect production locations, and in the case of Texas, they overestimate what proportion of exported goods are produced in the state. For a better indication of what portion of exported goods are actually produced by Texas firms, the Census Bureau recommends the report on exports from manufacturing establishments.
The latest establishment manufacturing survey reports Texas was a major exporting state in 2009. Chemicals were the major exporting industry group, with 29.6 percent of direct exports, followed by transportation equipment with 15.3 percent, petroleum and coal products with 13.7 percent, computer and electronic products with 13.4 percent and machinery with 11.4 percent. These five industry sectors made up 83.4 percent of the state’s manufacturing exports. Chemical exports show the importance of the state’s petrochemical industry. These data give a better idea of what is being produced by Texas firms and exported to the world.
Texas Exports Outperform the Nation
Texas’ 2000–12 manufactured exports grew by 7.2 percent compared with 3.8 percent for U.S. exports. A shift-share analysis of 2002–12 reveals that four factors impact Texas export growth: (1) national share, (2) industry mix, (3) competitive effect and (4) destination effect.
The net results when considering only regional factors indicate that Texas’ industry mix was concentrated in industries showing greater growth relative to the entire country. The positive competitive effect signals that local economic factors in Texas caused the state’s industries to grow faster than the nation’s. Finally, the destination effect shows that Texas exports were concentrated in high-growth foreign markets.
Metro Area, Custom Port Export Growth

The Houston-Sugar Land-Baytown region, a global behemoth in the petroleum industry, achieved an impressive export performance from 2005 to 2011. Its agglomeration of petroleum companies allowed exports to grow at an annual rate of 13.1 percent from 2006 to 2011, or 52.3 percent of the state’s exports (Table 1). This is five times more than second-place Dallas-Fort Worth-Arlington, which had 13.3 percent of the state’s exports (Figure 4 and Table 1). The state’s other two major metropolitan areas, San Antonio and Austin, had 5.3 percent and 4.3 percent of Texas exports, respectively (Table 1). San Antonio’s export growth outpaced the other major Texas metropolitan areas (Figure 4).

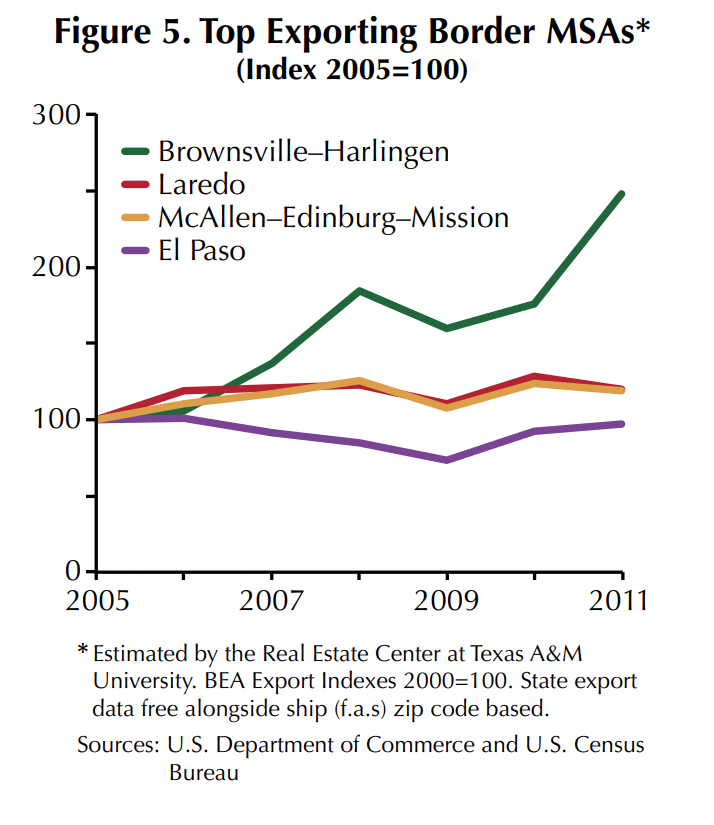

Texas’ other major exporting areas are border and port areas, including El Paso, the third-highest exporting MSA in the state (Table 1). Between them, these areas represent 19.4 percent of the state’s export movements. These are not manufacturing regions but custom ports where many exports leave the country. They are among the nation’s major exporting regions. Brownsville-Harlingen merchandise exports have grown at a greater rate than the other border MSAs (Figure 5).
Employment Benefits
Texas employment benefits from export manufacturing firms. Manufacturing-related jobs numbered 208,000 in 2009. Nonmanufacturing jobs stood at 359,700, including business (108,200), transport (53,400) and trade (97,200). They were 5.4 percent of all civilian employment and 6.5 percent of all private sector employment.
More than one-quarter of Texas manufacturing jobs are export related. Direct exports employ 137,100 while 71,000 are related to supporting shipments. The most export-related jobs are in transportation equipment, fabricated metal products, computers and electronics products, machinery and chemicals.
Foreign Companies in Texas
In 2010, there were 1,457 foreign firms in Texas. They employed 428,100, or 5 percent of the state’s total private workers. Most of the jobs created by foreign firms are in the manufacturing industry (38.9 percent). English firms generate 15.7 percent of employment by foreign direct investment (FDI; Table 2). Texas ranks third nationally in number of foreign firms, surpassed only by California and New York, and is second to California in number of jobs created by foreign firms. In addition to generating jobs, FDI results in firms bringing new capital and technology into the regional economy. That can lead to higher wages and income through productivity gains in how goods and services are produced.
International Shock Vulnerability
Texas as an open economy is not immune to international shocks, positive or negative, especially as a major exporter and beneficiary of FDI. So, if prices of international commodities change abruptly, or if another financial crisis erupts, Texas’ economy will be exposed to those shocks. The Texas economy is particularly vulnerable to shocks in the oil market. Major moves in the exchange rate of the euro, yen and yuan can impact Texas exports. A weaker U.S. dollar makes imported goods from the rest of the world more expensive and makes goods produced in the United States and Texas cheaper for international customers.
Texas has benefited from international trade and investment and should continue to do so in a world that is becoming more and more integrated every day.
For more information, see Center publication 2022, Texas’ Stake in International Trade Through its Exports and Some Foreign Direct Investments.
Dr. Torres ([email protected]) is an associate research economist with the Real Estate Center at Texas A&M University.
Did you like this Article?
You might also like

< 1 minute read
Apr 10 2013
Texas’ Stake in International Trade Through Its Exports and Some Foreign Direct Investment
Texas' border location, sea access, natural oil and gas resources, along with favorable labor costs and a friendly business climate have made it the top exporting state in the country...


