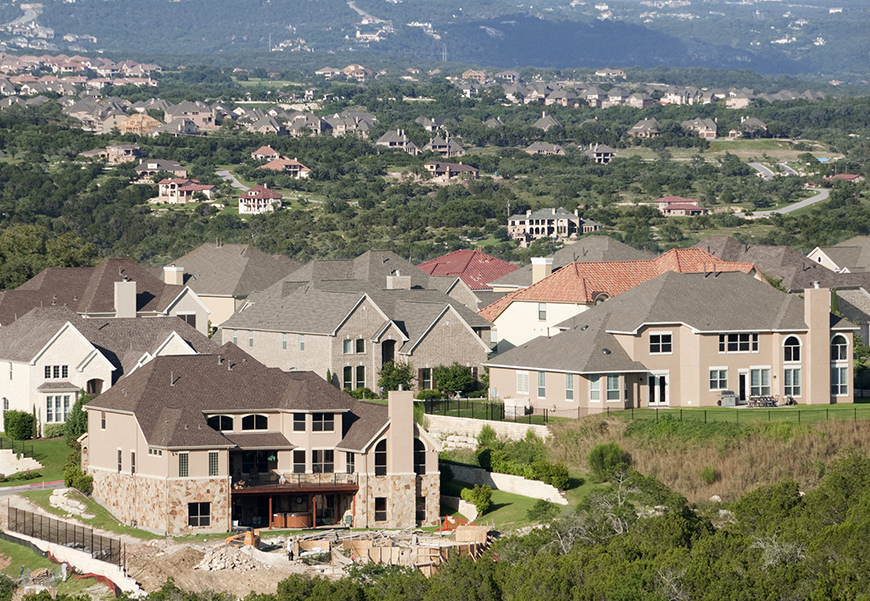
Austin’s reputation as a technology and science hub has attracted a growing number of residents in recent years, many of them high earners from out of state. This increase in housing demand, coupled with higher buying power and a still-low housing inventory, will likely keep area home prices elevated.
Jun 26, 2023
Austin’s Power
Why the Capital City's Home Prices Surged
The city that flaunts its reputation for being “weird” has become a major destination city for technology and science-based companies. That, along with other factors, has taken its toll on area home prices.
In response to 2020’s COVID-19 pandemic, the U.S government executed a series of steps, including interest rate cuts, to hold off economic calamity. What followed was an unprecedented increase in housing sales set off by a fall in mortgage rates to historically low levels. Housing markets across the country experienced a major boost in activity, but some markets stood out more than others.
Take Austin, for example.
The capital city already had a reputation for high-priced housing in a state that boasted affordability. It had a strong economy, attracted young talent, and had a migration boom, factors that only intensified beyond 2020. What followed was a price surge that drew much national attention.
Which Way to Austin?
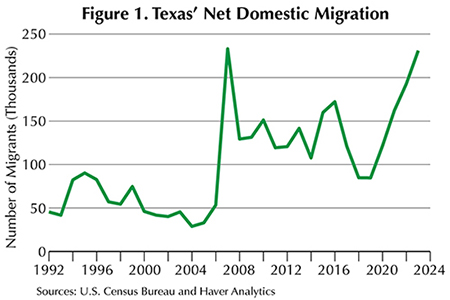
Texas has been a popular destination over the past ten years, welcoming a steady flow of migrants from other states. After 2020, Texas experienced a spike of inbound migration not seen since migrants from New Orleans relocated following the devastation of Hurricane Katrina (Figure 1).
Austin, especially, has been one of the state’s top destinations for new residents. Before 2020, Austin received an average of 48,335 new households. By 2021, that number spiked to 75,555. The city had already been trending upward since 2016, with 2019 setting a record of 53,680 new households.
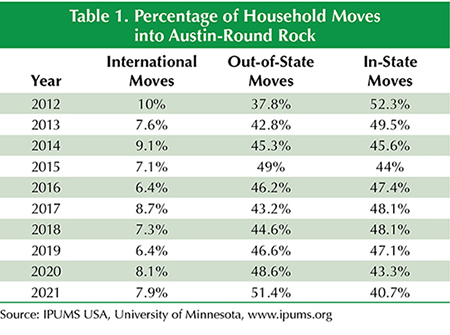
Before COVID, the majority of households that moved to Austin were from other parts of Texas (Table 1). Moves from other states were second, and international moves a distant third. Deep into the pandemic, the number of movers from other states exceeded the number from within Texas.
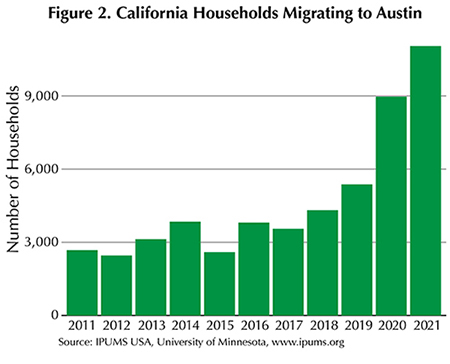
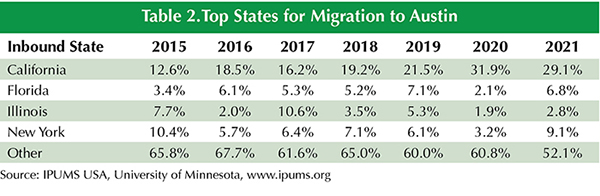
From which state did most movers come? California, but that’s true every year given the Golden State’s massive size. However, in 2020 and 2021 the number of households from California was more than double that of prior years (Figure 2). As a result, the proportion of out-of-state moves from California increased to almost 30 percent of all inbound moves by 2021 (Table 2).
One would think Austin would be a major destination for Californians, especially from the Bay Area, given both cities’ connection to technology and innovation. According to consumer data from Infutor Data Solutions, almost a third of California moves in 2021 came from the Bay Area and surrounding communities. Movers with a prior San Jose address accounted for 4.6 percent of moves, while San Francisco accounted for an additional 4.3 percent.
The largest overall city source in 2021 was Los Angeles with 6.5 percent of moves. That’s a bit underwhelming considering L.A. is many times larger than both San Francisco and San Jose combined. Probably the biggest surprise was San Diego with 5.6 percent of moves.
While California received a lot of attention in Texas during the pandemic, data show migration to Texas increased from many other sources. For example, the number of moves from New York climbed from 6 percent of total moves in 2019 to 9 percent in 2021 (Table 2). North Carolina was another top state in the inbound pipeline, likely because of similarities between Austin’s and Raleigh-Durham’s economies and demographics.
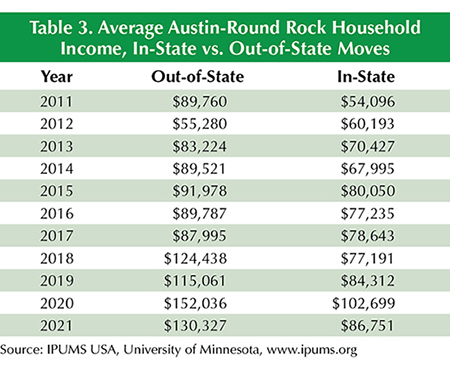
Regardless of where people came from, they brought a lot of earning power. In 2021, the average household income of out-of-state movers was $130,000 (Table 3). Households moving to Austin from other parts of the state earned $87,000 on average. Up until 2017, the earnings differential was minimal. After that, the gap widened, with the largest difference occurring during COVID.
Tech-Driven Employment Explosion
Like migration, Austin employment growth exploded during COVID, making the metro’s economy one of the quickest to recover. That growth was driven largely by professional and business services, which include a lot of higher-income jobs.
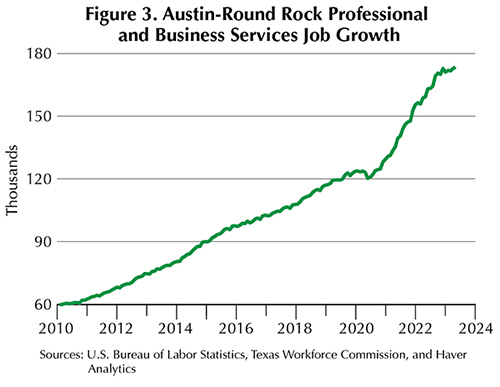
Growth in Austin’s professional and business services sector was already strong, ranging from 3 to 8 percent year-over-year growth in the decade leading up to COVID (Figure 3). Texas’ growth in this sector was closer to 5 percent year-over-year in 2019. Like elsewhere, Austin’s job numbers fell drastically in April 2020 but quickly bounced back by that August. After that, growth continued to expand at double-digit rates before hitting the ceiling in October 2022. Since then, month-to-month growth has been minimal, but overall employment levels remain considerably higher than 2019 levels.
In most major metros, such as Dallas-Fort Worth, professional and business services includes white collar jobs such as accountants, lawyers, and executives. In Austin, however, that category leans heavily in the technology and sciences sectors, and jobs in those sectors grew at the fastest rates between 2020 and 2021.
For example, computer systems design expanded over 40 percent in just two years, resulting in 17,600 new jobs. Estimated annual wages for this occupation also grew quickly during this period, expanding from almost $140,000 to $164,000. These jobs earn more than the mean household income in Austin, which was $115,863 in 2021.
Hot Housing Market
Regardless of where they came from, plenty of potential homebuyers came to Austin with major buying power amplified by record-low mortgage rates. The result was one of the most intense housing markets nationally.
Even with the April 2020 statewide shutdown of housing activity, Austin reached a new milestone for monthly home sales by July: 4,481 sales, an almost 20 percent increase from the year before.
The housing market was hot, but the supply was not enough to keep up. Despite strong demand, home listings never matched the sales pace, resulting in tremendous pressure in home prices.
Home Prices’ Rapid Rise
While home sales peaked in the summer of 2020, home prices would not peak for almost another two years. The most notable change in prices occurred during the first half of 2021. The highest point was in May 2022 when the median home price reached $550,000 (Figure 4), a far cry from the $328,000 recorded in May 2020.
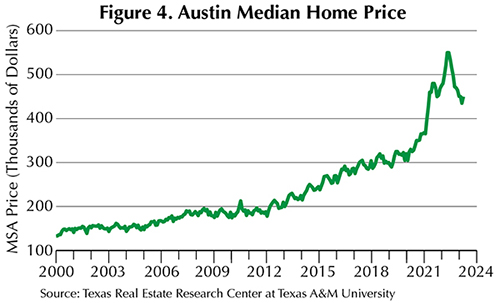
For the next few months, Austin home prices declined in large part due to the drastic rise in mortgage interest rates influenced by the Federal Reserve’s inflation-fighting policies.
During this time, concerns about housing bubbles and crashes began to intensify. By December 2022, the median home price retreated to $450,000. Between then and March 2023, home prices hovered there, signaling that the worst may be over.
Looking Ahead
Going forward, general speculation remains concerning Austin’s housing market.
So far this year, sales have been underwhelming compared with the past five years. Homes took far longer to sell in March 2023 (80 days on average) than they did 12 months before (22 days on average).
Home prices have remained stable for the past few months with the help of chronic low listing counts. While listings have increased since 2021 and 2022, they are essentially back to pre-COVID norms, which at that time meant tight markets. Combined with strong migration, low inventory levels may keep Austin prices elevated even after the initial drop at the height of the market.
Takeaway: Austin’s reputation as a technology and science hub has attracted a growing number of residents in recent years, many of them high earners from out of state. This increase in housing demand, coupled with higher buying power and a still-low housing inventory, will likely keep area home prices elevated.
____________________
Roberson ([email protected]) is a lead data analyst and Natarajan ([email protected]) a senior data analyst with the Texas Real Estate Research Center at Texas A&M University.
Did you like this Article?

You might also like

Single-family
5 minute read
Jul 03 2023
What’s Driving Austin Home Price Appreciation?
Austin’s home prices have increased rapidly over the last few years. In 2019, the reported average sales price of a home was $393,138. By 2021, that number had risen to $564,974, a 44 percent overall increase and a 20 percent average annualized rate of price increases.


