


Cropland in Demand: But Large Tract Sales Wither
In spite of the drought, farmers are buying up cropland. Rangeland isn’t selling because buyers and sellers are digging in their heels, trying to wait each other out. And big tracts aren’t moving at all.
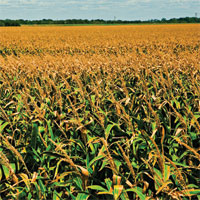
In 2011, Texas land markets reflected continuing demand for secure investments through sustained price increases for cropland. Market pressures were especially strong in irrigated cropland markets, helping to stabilize overall price levels statewide.

Prices increased in the Panhandle and South Plains, West Texas, and Wichita Falls regions. Panhandle and South Plains prices shot up 20 percent. However, the stability in these regions contrasted with falling prices in many other locales, where markets were challenged by slow volume. The more urban areas in the northeast and far south posted weaker prices. This mixed bag of results led to a statewide price per acre of $2,150 (Figure 1), a 3 percent overall increase from 2010.

The real or inflation-adjusted price of $396 per acre in 1966 dollars was still less than the record-setting 2008 level of $424 but marked a 2 percent rise from the 2010 annual price.
Tract Size and Volume of Sales
Small-sized transactions continued to dominate the overall market as the 2011 median of 74 acres exactly matched the 2010 typical size (Figure 2). That size remains much smaller than the 100-acre levels seen from 2000 to 2005.

Large properties were mostly absent from the mix of sales. Brokers reported the impasse over pricing continued between potential buyers and sellers of larger tracts.
The 4,520 sales reported fell just short of the 2010 total of 4,747 (Figure 3). If reported sales were indicative of current market activity, sales volume had returned to late ’90s levels. The year-to-date annualized trend toward stable volumes prevailed in virtually all of Texas. Statewide, the volume trailed 2010 levels by just 4.8 percent.


The decreased number of large transactions was reflected in the total acreage sold (Figure 4). Sales in 2011 transferred a total of 1,044,474 acres compared with 1,052,957 acres in 2010.
By contrast, 3,086,339 acres sold in 2005. Subdued sales volumes began at the end of 2008 and continued through 2011.
Market Trends
In 2011, renewed interest in cropland combined with a fear of inflation to put upward pressure on cropland prices. However, for the third straight year, large properties sold less frequently than in past years. Sales volumes lagged the transaction numbers from recent years and posted volumes last seen from 1990 to 2000.
These facts reinforce information gathered from appraisers and brokers who report potential buyers continue to make low offers presuming that prices will drop eventually. Buyers are hesitant to pay current prices, but increasing numbers have grown weary of delaying their purchases.
Lacking an external shock to the economy, market prices have firmed. However, transactions involving an unusually low number of acres continue for the third straight year.
These circumstances reflect the general discomfort in the economy as the world continues to grapple with the problem of excessive debt creating turmoil in financial markets. These disquieting forces create a heightened apprehension of risk and suggest buyers will continue to expect price erosion while sellers resist sales at prices below recent historical norms.
Anecdotal evidence suggest that cropland investors continue to actively seek land. However, dismal yields followed last year’s historic drought, and the threat of substantial changes to government crop supports threaten the basic forces supporting demand. While these circumstances have not weakened demand for cropland, they have muddled prospects for the future.
Rangeland markets face formidable challenges as potential buyers anticipate lower prices and sellers refuse to accept low-priced bids. Transitional tracts near urban areas still face slack demand over the coming year. On the other hand, bustling activity in the oil patch continues to inject cash into Texas communities. Mineral producers and royalty owners have realized substantial profits with no end in sight.
Evidence is beginning to emerge indicating that some of this prosperity has begun to focus on land. Given these confusing trends, statewide prices may modestly increase in 2012. However, sales volume is not likely to expand in the near future.
Dr. Gilliland ([email protected]) is a research economist, Klassen ([email protected]) a research analyst and Garcia a research assistant with the Real Estate Center at Texas A&M University.
April 2012
![]()
You might also like


Turning Soil
It’s basic economics: crop production will always be influenced by supply and demand. For a textbook example, look no further than Northeast Texas, where the crop portfolio is once again changing. The twist? Cotton could make a comeback with the help of some innovative thinking.


Tierra Grande
Check out the latest issue of our flagship publication.