Competition between farmers and institutional investors is keeping cropland markets healthy throughout the nation’s farming areas. High crop prices in 2008 put cash in farmers’ pockets, while institutional investors were hamstrung by maximum price limitations.
Oct 18, 2010
High Cotton: Cropland Values Grow
Great crop prices in 2008 put cash in the pockets of farmers who are now buying cropland left and right, often at prices institutional investors cannot afford to pay.

It was the early 1980s, and the spectacular crash of farm income drove investment buyers away from farmland markets. Farm incomes dwindled as agricultural exports plummeted, and farmland values began a pronounced decline that persisted for more than seven years. Other types of real estate began losing ground in 1986, reinforcing this aversion to land.
However, investors gradually began to sense potential profits for those brave enough to buy farmland at 1990s prices. Then, in 2004, financial market studies suggested that efficient investment portfolios should contain an allocation to real estate. Institutional investors began to notice rising trends in commodity prices and flourishing farmland markets. Land market participants noticed investors entering farmland markets with increasing frequency.
Since 1992, the National Council of Real Estate Investment Fiduciaries, a group primarily composed of institutional investors, has calculated a Farmland Index that indicates agricultural farmland provides high volatility–adjusted returns. Armed with ample funds, these investors contributed to a rising trend in normally static cropland prices. (For more information, see “Pay Dirt: Farmland as Investment,”.)
When stock prices declined precipitously in March 2009, the value of stock-based portfolios plunged. That decline meant that farmland investments composed a greater percentage of portfolio value. Institutions were suddenly overallocated to farmland. Many began to curtail acquisitions to rebalance their portfolios. This strategy, coupled with declining commodity prices returning to reasonable levels after reaching record highs in 2008, led to weakness in 2009 cropland prices in many farming areas.
Then the stock market began to recover, restoring the value of institutional investors’ stock-based holdings. Suddenly, these investors were no longer top heavy in real estate. They again began to search the markets for farmland investments. Only this time they encountered aggressive competition from farmers buying land.
Historically, farmers have populated the pool of cropland buyers. Conventional wisdom sees their willingness to pay for land as a direct function of the bottom-line return on agricultural production on the land. This view of the market sees prices as a reflection of a capitalized value of projected net income accruing to owner-operators.
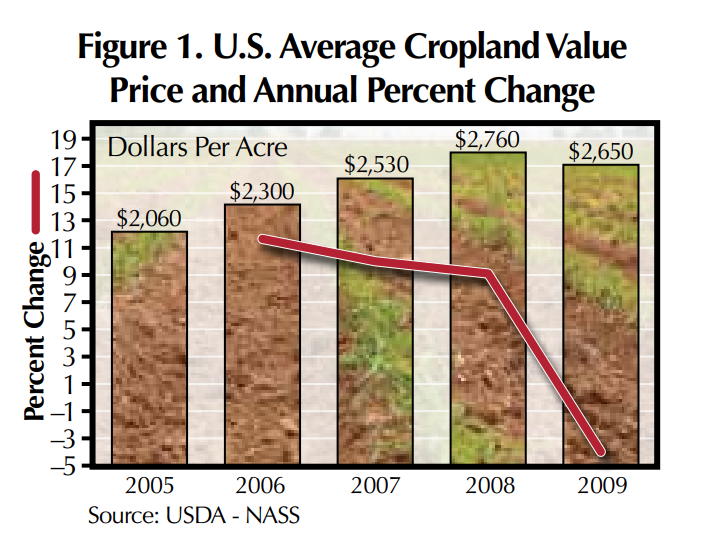
Soaring crop prices in 2008 fueled a feverish rush to buy land and pushed up the United States Department of Agriculture’s (USDA) estimated value of all land and buildings on farms in that year. In addition to the portfolio allocation factor that emerged with weakened stock prices in early 2009, weakened commodity prices and high input costs squeezed net incomes as well, spoiling many investors’ appetites for farmland.
USDA estimated a 3.2 percent drop in the value of all land and buildings on farms nationally in 2009. Separately, cropland values retreated 3.9 percent nationally, according to USDA estimates (Figure 1).
Despite the negative influences, conditions in markets for other investment vehicles, like stocks and bonds, can cause capital to flow into farmland investments. Specifically, when the return on alternatives sags to low levels and investor uncertainty remains high, farmland becomes an attractive option. Farmland also offers security when investors fear an inflationary shock is ahead.
Farmers, flush with cash from the phenomenally high 2008 crop prices, found themselves with reserves after retiring debt and purchasing equipment. CD rates at their local banks offered miniscule returns. Many opted to plow the capital into more farmland. This constellation of factors prompted spirited competition for farmland and left many institutional would-be buyers scrambling to find suitable acreage.
Observers report this phenomenon is widespread throughout America’s farming areas. Confined to an upper-limit price, institutional investment buyers frequently find themselves at a disadvantage when bidding against farmers at auctions. They watch helplessly as farmers exceed the institutionally approved maximum price.
In some transactions, institutional investors marvel at the amounts neighboring farmers pay for acreage. Their evaluations of the subject land resource quality lead them to believe that the farmers are willing to accept a very low return on their investment. With no alternatives that would yield strong returns, however, and possessing machinery that can effectively work the land, farmers can afford to be the highest bidders.

Protected from uncertainty with an asset they know and appreciate, farmers have led the charge to keep South Plains of Texas rural land prices growing throughout 2009 and into 2010 (Figure 2). This area is primarily made up of cropland. (For more information on this area, see Texas Land Market Area 3.) The area posted an increase in median price per acre during 2009, while many other areas saw prices slide. Competition among investors undoubtedly contributed to that result.
Dr. Gilliland ([email protected]) is a research economist and Gunadekar is a former research assistant with the Real Estate Center at Texas A&M University.
Did you like this Article?
You might also like

Land Markets
6 minute read
Feb 08 2022
Dynamics of Texas’ Rural Land Market
A model of Texas’ rural land markets reveals dynamics similar to those observed in general investment markets. These results contrast with the conventional paradigm focused on the illiquid and inflation-hedging qualities of rural land markets.


