A Center research study revealed that Texas’ housing supply flexibility (HSF) helped the state through the 2006-12 housing crisis by keeping home prices lower than the national average. HSF measures how housing supply responds to changes in housing demand.
Apr 3, 2013
Home Stretch
Housing Supply Flexibility
Texas’ housing supply flexibility kept home prices here from skyrocketing in the boom years. That’s why Texas avoided the heartbreak of a housing bubble. And that’s why housing supply flexibility is a good thing.

Nearly a decade ago, home prices starting shooting up all over America. Double-digit price gains every year were commonplace in California, Arizona, Nevada and Florida. In Texas, home prices were increasing but at a much slower pace. Center staff frequently were asked why.
Homebuilders in Texas have kept the supply up, which in turn kept prices at a reasonable level. In scientific terms, Texas has a higher Housing Supply Flexibility (HSF) — how housing supply responds to changes in housing demand — than the rest of the country. A high HSF kept home prices here from skyrocketing in the boom years, and helped Texas avoid the massive collapse in home prices that has plagued the rest of the country for the past five years.
Ever since nationwide and regional home price data have been available, Texas residents have enjoyed higher levels of housing affordability, mainly because of home prices lower than the national average. The state’s economy did not experience a home price bubble in the nationwide housing crisis of 2006–12. The Real Estate Center conducted a research study on the interactions of supply and demand in the Texas housing market. The research revealed that Texas’ HSF played a key role in keeping Texas home prices lower than the national average and in helping the state weather the housing crisis.
Measuring Housing Supply Flexibility
This study defined housing supply flexibility as the ratio of home supply to home demand. Demand for housing units in a period was measured as the number of homes sold. Housing supply was measured as homes sold plus homes for sale at the end of the period (that is, the total number of listings).
The study used annual data on homes sold and homes for sale in the United States and in Texas from 1989 to 2012. U.S. data on existing homes sold came from the National Association of Realtors; data on new homes sold came from the U.S. Census Bureau. The Real Estate Center was the source of annual Texas data.
Historical housing supply and housing demand trends for Texas and the United States are shown in Figures 1 and 2. Dividing housing supply data by housing demand data produces HSF ratios for Texas and the United States (Figure 3), which show three major trends in HSF ratios.


First, there was a downward trend in HSF ratios for both the nation and Texas from 1989 to 2006, when the housing crisis began. HSF for Texas fell from 2.06 in 1989 to an all-time low of 1.37 in 1999, increasing to 1.49 in 2003 before falling to 1.40 in 2006. The HSF ratio for the nation fell from 1.57 in 1989 to an all time low of 1.34 in 2004, before the housing crisis. This trend shows it has been increasingly difficult for the supply side of the housing market to respond to increasing demand for homes since 1990.
The second noticeable trend is that Texas had a higher-than-national-average HSF ratio from 1989 to 2005. The average ratio of housing supply to housing demand for Texas during that period was 1.59 compared with 1.44 for the United States. From 2005 to 2010, the U.S. ratios exceeded the corresponding Texas ratios mainly because of the nationwide housing crisis, which was characterized by falling housing demand and the collapse of home prices in several major U.S. metro areas.
The recent downward trend in HSF ratios for Texas and the nation in the aftermath of the housing crisis points to tightening housing supplies. But Texas’ housing sector asserts more supply flexibility as shown by higher-than-national-average HSF ratios.
HSF depends on a number of factors. The most important are the availability and costs of land and construction materials, land use regulations, housing construction regulations, and length and complexity of land development processes from land acquisition to construction and sales of housing units. The construction industry and the real estate industry play key roles in HSF given that homes supplied and sold include both new and existing homes.
HSF, Home Price Appreciation
Economic theory posits that higher (lower) supplies of goods and services and more (less) responsiveness to growing demand by the supply sides of goods and services result in lower (higher) prices of goods and services. Both Texas and the nation had an upward trend in home prices in response to the downward trend in the ratios of home supply to home demand (Figure 4). But median home prices in Texas have stayed below the national average thanks to more supply side flexibility in the housing market from 1989 to 2012.

The gap between Texas and U.S. median home prices was $29,700 in 1989 and reached an all-time high of $86,000 in 2005 (Figure 4). After the nationwide home price bubble burst, the gap between median home prices for the United States and Texas narrowed to $23,500 in 2012.
To investigate and quantify HSF’s impact on home prices, this study estimated the relationship between growth rates of home prices in real terms and the ratios of housing supply to housing demand for Texas and the United States. Growth rates of home prices in real terms are growth rates of home prices less inflation rate.
Employing the statistical technique of regression analysis shows the estimated relationships between home price appreciation (depreciation) and the HSF ratios for Texas and the nation (Figures 5 and 6).
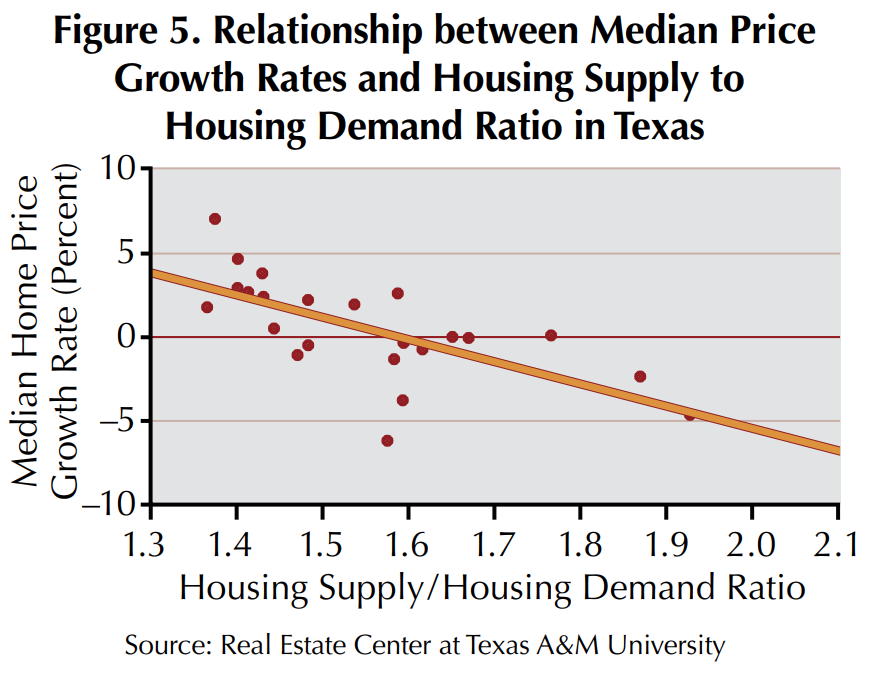

In Texas, growing home price appreciation in real terms is associated with HSF ratios smaller than 1.59 (Figure 5). For the nation’s housing market, median home prices are expected to increase as long as HSF ratios are less than 1.49 (Figure 6).
Texas has survived the first housing collapse of the 21st Century. One of the key reasons is builders in our state can respond quickly to increased demand. This keeps prices from escalating at an unsustainable rate. Consequently, when the Great Recession came, there was no price bubble to burst.
Dr. Anari ([email protected]) is a research economist with the Real Estate Center at Texas A&M University.
Did you like this Article?
You might also like


5 minute read
Aug 07 2017
Is Something Wrong with Texas Home Prices?
Since 2012 Texas housing prices have been rising faster than incomes. Rapid home price increases affect the stability of the fundamental relationship between income, demand and supply, and home prices. Home price increases should be based on fundamentals.


