


How Texas Became a Leader in Professional Services
As one of the nation’s top markets for professional, scientific, and technical services, Texas must now navigate major shifts driven by work-from-home and artificial intelligence.

Professional, Scientific, and Technical (PST) services are vital for running a modern economy. This broad collection of service industries groups together many subsectors including accounting, management consulting, legal services, engineering, computer, and other design services. These functions are needed throughout the economy but are in heavy demand by other businesses. Thus, they are concentrated in cities with many corporate headquarters.
PST firms are also important to the health of commercial real estate as they are typically anchor tenants in prime office buildings. As Texas has grown in population and sophistication, its PST industries have grown with it. How much growth will the industry see in the coming months? For a better understanding, it’s important to document trends in Texas PST services and their position in local office markets. The proliferation of work-from-home and artificial intelligence is also poised to make an impact.
Texas Big Four vs the Rest
A few Texas cities rank among the national leaders for corporate headquarters. These local business ecosystems support our largest and most diverse clusters of PST firms. For example, Texas is home to almost 11 percent of the 2024 Fortune 1000 largest publicly traded companies. This includes 47 headquarters in Dallas-Fort Worth, 44 in Houston, and seven each in Austin and San Antonio. These headquarters consume billions of dollars in professional services and attract PST firms to their home markets.
A few Texas markets also stand out as international business hubs. Among the 1,000 global cities in Oxford Economics’ 2024 rankings, Texas’ Big Four are represented: Dallas (18th), Houston (25th), Austin (39th) and San Antonio (105th). Historically, the major U.S. hubs for PST firms and employment were in the northeast corridor (Boston, New York, Washington), California (San Francisco, Los Angeles), and in Chicago. Texas has dramatically outgrown those established markets in recent years and now has a total PST service workforce comparable to the legacy hubs (Figure 1).
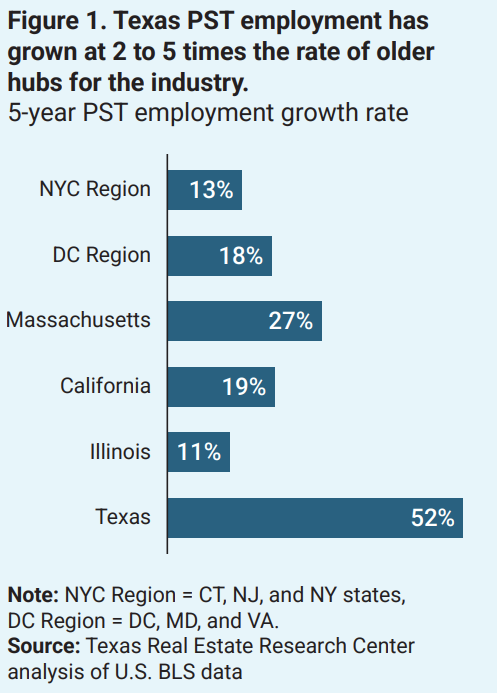
Overlay current employment in 1,000s: NYC Region = 1,167, DC Region = 881, Massachusetts = 369, California = 1,389, Illinois = 440, Texas = 1,078.
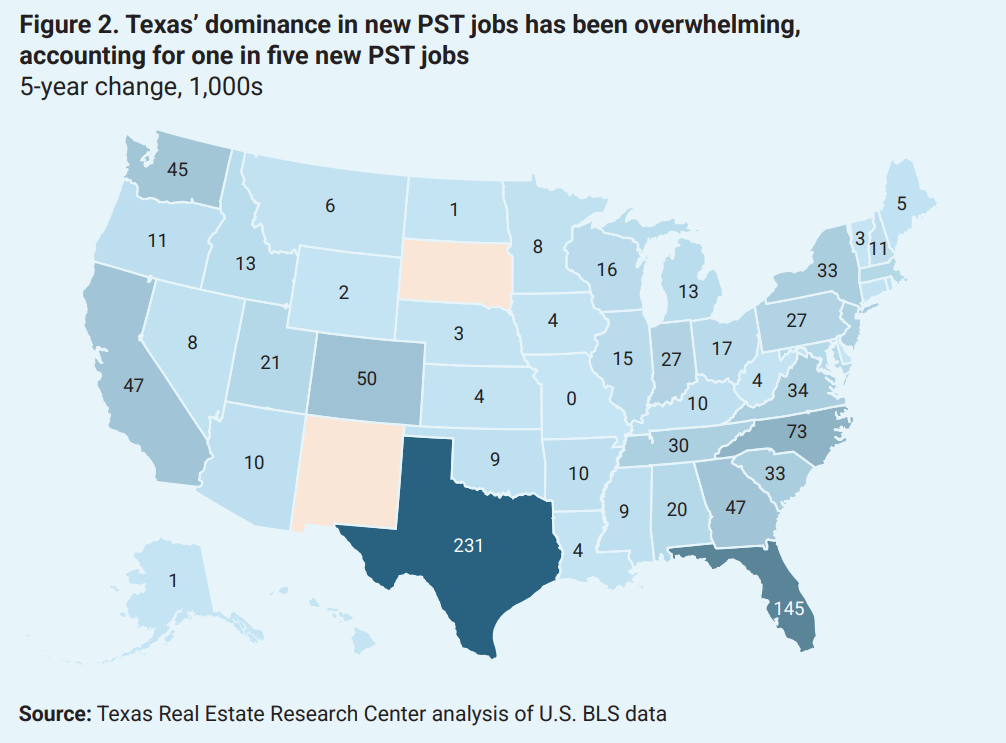
Texas PST service job growth has exceeded that of older hubs with Texas adding 231,000 jobs in the last five years (Figure 2). The Lone Star State accounted for one in five such jobs added nationally in the last five years. Within this overall strong growth, the computer system design and accounting subsectors have seen the most rapid increase with five-year growth rates of 38 and 27 percent, respectively.
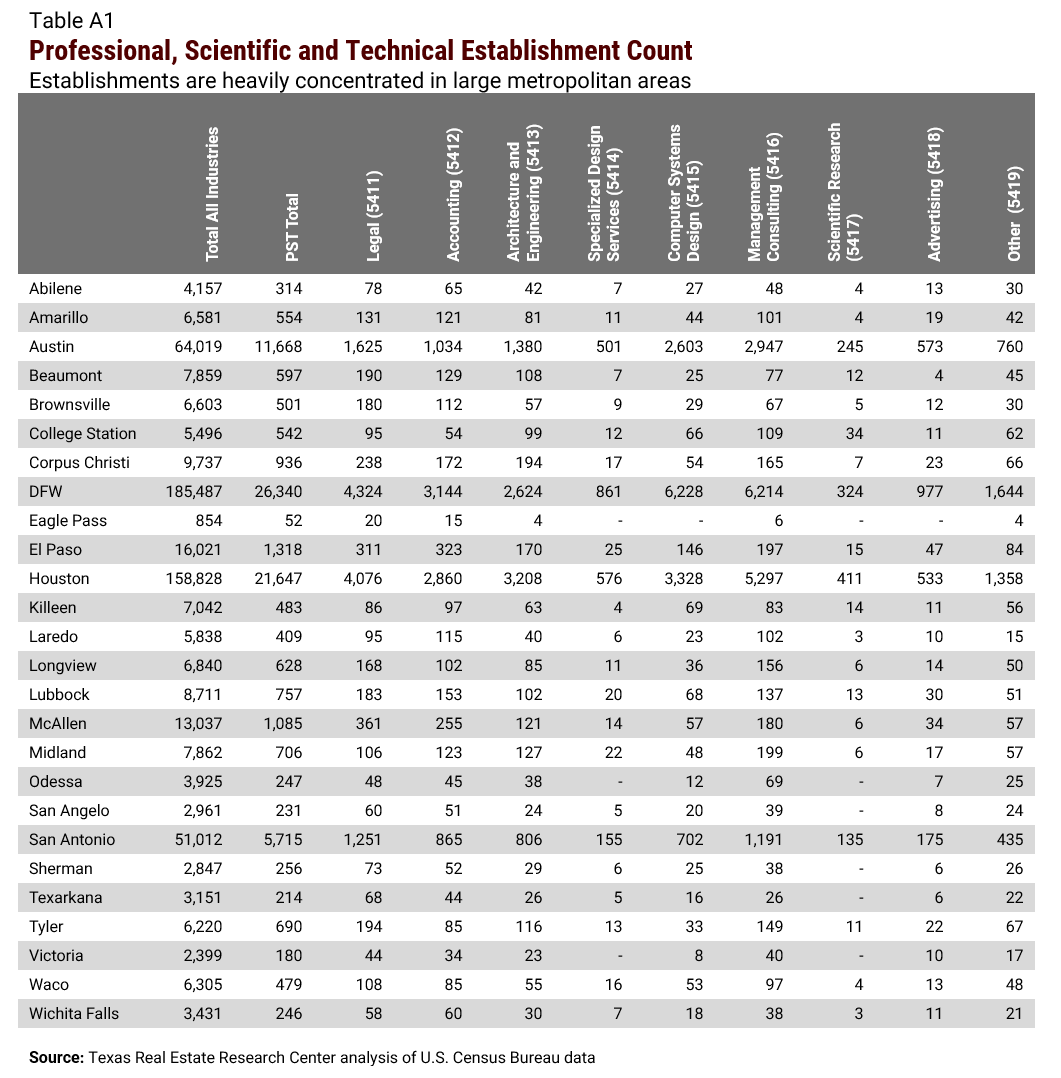
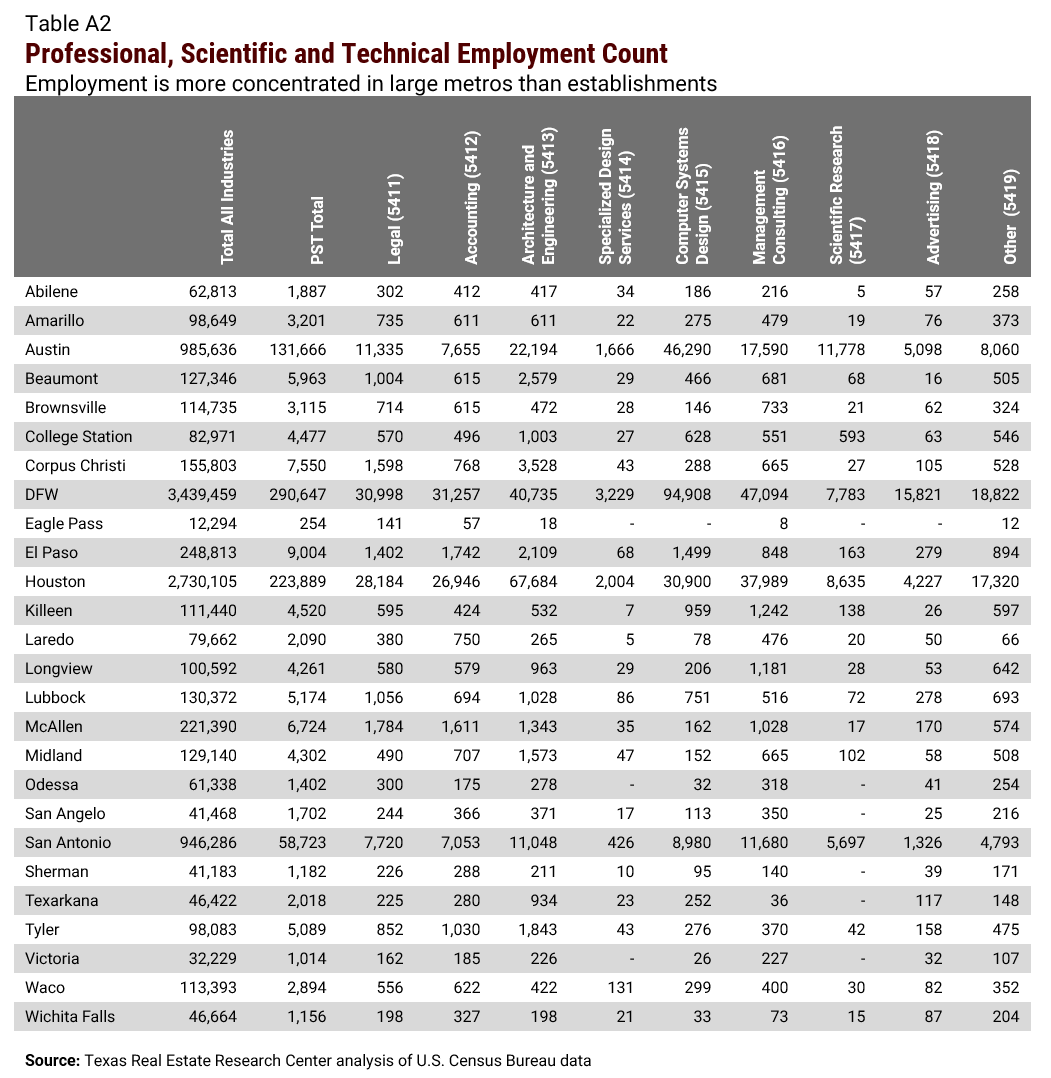
Just as national growth has been concentrated within Texas, the activity has been heaviest in the largest cities (Table 1). Austin and DFW increased their share of the state total over the last decade. San Antonio held its own, and Houston lost market share, as has the rest of the state combined. Houston’s poorer performance reflects the lingering effect of the 2010s oil bust. With many energy companies headquartered in Houston, there were fewer growth opportunities for professional services even as more oil and gas firms relocated there. San Antonio has not historically been a headquarters market. Both cities have been less fertile ground for PST businesses.
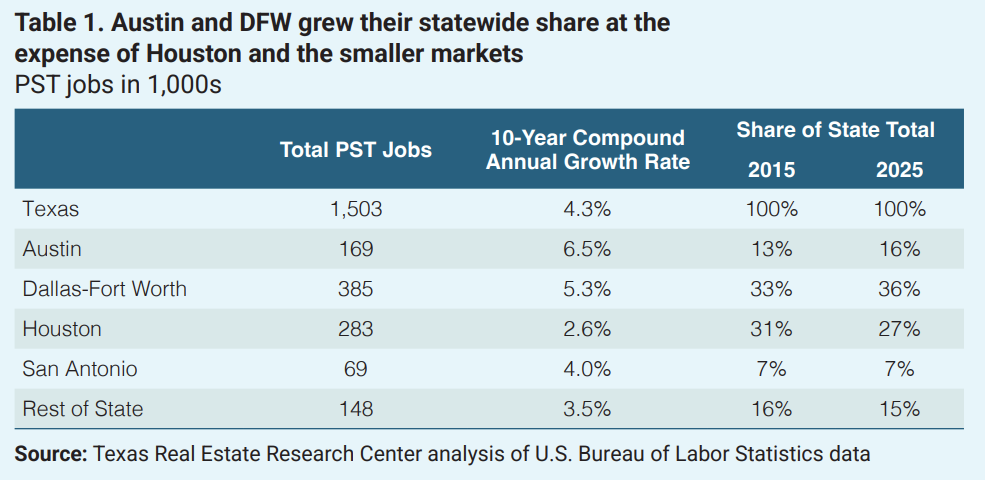
In contrast, DFW has the most diverse mix of headquarters industries in Texas. Its standing as one of the country’s two headquarter hubs (along with Chicago) helped local firms grow and attracted national PST players. Austin PST success was built on a growing cluster of small and midsize software businesses and relocated branch and headquarter operations of established firms. Being home to the state government also makes Austin an attractive location for legal and management consulting businesses.
PST Firms as Major Office Users
As noted earlier, PST firms are important office tenants, and their success is good news for long-term office demand. A CoStar search of PST service industry firms statewide produced over 2,000 leases for tenants occupying at least 10,000 square feet. This totaled 62.5 million square feet, or about 5 percent of total office inventory. These tenants represented almost $1.7 billion in lease payments for building owners in 2024. Texas’ Big Four metro areas account for 94 and 95 percent of the total space leased and associated jobs, respectively. The share of total space leased in each metro area is: DFW (42 percent), Houston (34 percent), Austin (13 percent) and San Antonio (5 percent). The top three ZIP codes for leased space and employment are in the downtown areas of Dallas, Houston, and Austin.
The largest PST service firms occupy larger spaces, but, as is common for most industries, they lease fewer square feet per employee. Small tenants (fewer than 20 employees) are found to lease more than 1,000 square feet per worker. The largest tenants (more than 250 employees) take little more than 100 square feet per employee.
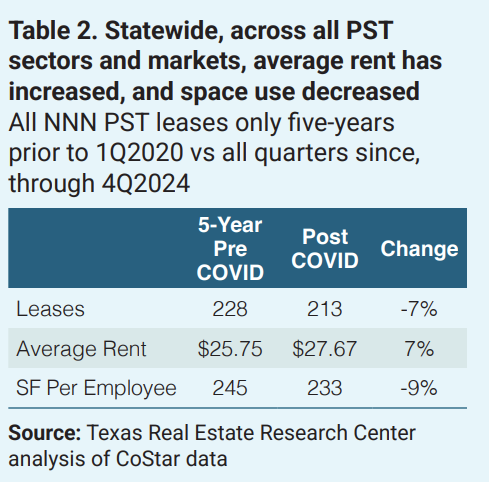
There are some changing trends in these leases. Limiting the analysis to triple-net (NNN) leases only, firms commencing leases before COVID-19 took more space per worker than those commencing after first quarter 2020 (Table 2). Space per worker fell 9 percent after the pandemic shutdown. Weighted average rent (controlling for lease size) was 7 percent higher for the post-pandemic leases. When tracked on an annual basis, there is evidence that the most recent leases have seen tenants increasing their space per worker once again. These firms may be taking advantage of a “buyers’ market” since most office hubs have ample unused space.
Four PST subsectors and two office markets have at least 50 leases before and after 1Q2020. Table 3 collects the detailed trends. The industry results reflect those industries’ leases statewide. The market results, however, include leases for all PST subsectors locally.

It’s generally true that average rent was higher after the pandemic shutdown in 1Q2020. The sole exception is in Houston, where rent was 5 percent lower after the shutdown. DFW rents were up 21 percent after. Statewide, rents were higher in all four industries with an increase ranging from 15 percent increase in management consulting to a 111 percent increase for computer services. Legal firms paid the highest rent per square foot before and after.
In terms of leased space per employee, each subsector had smaller post-shutdown averages, except for management consulting, which saw a 25 percent increase in space use. Legal services leased the most space per worker before and after the shutdowns. Computer services had the lowest space per employee before and after. Architecture and engineering firms swapped places with management consulting. The former had more space per worker before COVID-19, but took fewer square feet per employee after.
The metro market patterns align with expectations given their recent histories. First, DFW rents were higher in the post-shutdown era and Houston rents were lower. Prime office construction in DFW far exceeded that in Houston resulting in fewer new building options in the latter. DFW delivered new Class A+ buildings equal to 2 percent of total inventory. Houston delivered less than 1 percent of inventory by comparison. Given low office space utilization, almost all recent rent increases have been firms moving into new premium buildings that can command higher rents from top-tier tenants. A combination of lackluster oil and gas activity and less new space meant few tenants willing and able to move “up market” in their real estate choices.
Second, the DFW market has benefited from PST service expansions, especially by out-of-state law firms. These firms, accustomed to paying high rents in coastal markets, were happy to take some of the best local spaces to attract top talent. Houston tenants took slightly more space per worker. There was little difference in the change in space use with DFW and Houston seeing decreases approaching 10 percent.
Given these findings, PST industries should maintain their space demand, at least in the near term. Overall growth in most markets will partly offset declining space per employee trends. Longer term, two issues may determine if building owners will see increasing or decreasing net demand for their assets. These are work-from-home policies and the rise of AI, and both may lower long-term demand.
How Work-From-Home Could Impact PST Office Demand
Remote work was a growing trend before 2020, and then pandemic shutdowns saw practically the entire office segment shift temporarily to fully remote work. Since then, the PST sector has maintained the highest remote work share of any industry. In recent years, management has repeatedly tried to impose more in-office activity without much success. In the latest (2024) workplace trends survey from Global Commercial Real Estate Services, while 80 percent of employers want at least a 65 percent office utilization rate, only 38 percent of them are achieving that.
In fourth quarter 2024, human resources firm Robert Half found that more than one-third of job postings in categories like legal, accounting, technology, and design were fully remote or hybrid. Finally, looking worldwide, McKinsey & Company projects a much lower need for office space from the widespread adoption of work-from-home. Globally, office demand in 2030 could be 13 percent lower than what was expected if pre-pandemic trends had continued.
It’s too early to tell when and to what extent employers will succeed in bringing most workers back to the office. A severe economic downturn usually gives management more leverage than employees. In recent years, however, stiff competition for talent made employers reluctant to lay off workers. If federal immigration policy becomes more restrictive, as promised by the Trump administration, workers’ preferences for hybrid and remote work may carry the day and weaken long-term demand for office space.
Will AI Impact PST Office Demand?
We are in the early days of AI, and how businesses deploy it may determine the fate of office markets in Texas and around the world. Some recent findings give a glimpse of the future. In research conducted by the Federal Reserve Bank of St. Louis, AI use varies from industry to industry. It also varies substantially across individuals. Some workers use it daily and others much less often. PST services are grouped with administrative operations in a broad professional and business services super sector. The St. Louis research notes the broader sector is a medium adopter of AI compared to other industries, but the productivity impact is above average. Across all industries, AI is estimated to make workers 33 percent more productive in an hour of work that includes AI use.
In another paper, a team largely at Harvard University worked with Procter & Gamble to study real work tasks in a randomized experiment. The study spanned multiple departments and assigned tasks to one of four study arrangements: to a single worker, to two workers, and to single and two-person teams assisted by an AI tool. The statistically significant results were rather dramatic. A person paired with AI performed as well as two humans or as well as two humans using AI. Results like these suggest firms have considerable opportunity to achieve their output goals with fewer workers.
Ultimately, the local office market impact of work-from-home and AI may depend on the overall success of PST firms. It may turn out that both trends reduce the national demand for office space, but that some local markets benefit from their tenants making the best use of both. Workplace flexibility has been adopted by businesses as an essential tool in the competition for talent. Firms dependent on top-tier talent may be compelled to make some concessions to workers. Headquarters and PST hubs like Dallas, Houston, and Austin compete globally and national and multinational firms there will need to match the expectations of a mobile and in-demand workforce. With Texas’ favorable business climate, our office hubs may enjoy net leasing gains compared to the older, more established hubs on the coasts.
A similar dynamic is possible with AI. As with companies’ adoption of previous technologies (think personal computers), expect to see winners and losers with some firms putting the new technology to better use. This will give those firms a competitive advantage over the rest of the industry. In some instances, entire clusters of firms in certain cities may emerge as leaders in a changing industry. Some Texas cities are already becoming leaders in industries and displacing older hubs. Houston’s dominance in energy, Dallas rise as a global headquarters hub, and Austin’s success in various information technology segments came at the expense of other markets.
Similarly, there may be opportunities for Texas PST firms to use AI to outcompete firms in other cities and maintain or grow their demand for office space here rather than in other states. While northern California is the world hub for developing AI tools, there is not yet a leading region for the business application of AI. An international team studying county-level job postings reveals that Texas is no worse or better off than the rest of the nation in AI uptake. The authors of this report noted that “counties with stronger innovation ecosystems, higher STEM degree attainment, and tighter labor markets have seen greater AI job growth, whereas manufacturing-heavy regions and areas with high labor turnover have faced challenges in integrating AI.” Texas comes off as rather average in these terms, so there is room to succeed or fail in the coming years. Again, Texas’ economic fundamentals may give a marginal boost to local professional services firms and their need for office space.
Adjusting for work-from-home trends and adding a generous helping of AI speculation, PST firms will maintain their current demand for office space. There is modest upside potential. Major markets will benefit the most, but the ongoing shakeout in office markets will continue, with the best buildings in attractive submarkets gaining tenants over time.
Daniel Oney, Ph.D. ([email protected]) is research director with the Texas Real Estate Research Center.

You might also like


Tierra Grande
Check out the latest issue of our flagship publication.