Texas Housing Insight | April 2023
April’s housing sales slipped uniformly in the Big 4 Texas metros. As buyers adjusted to currently inflated rates, the loss in sales was primarily due to the lack of home supplies as construction activities slowed and sellers’ unwillingness to give up their low rates.

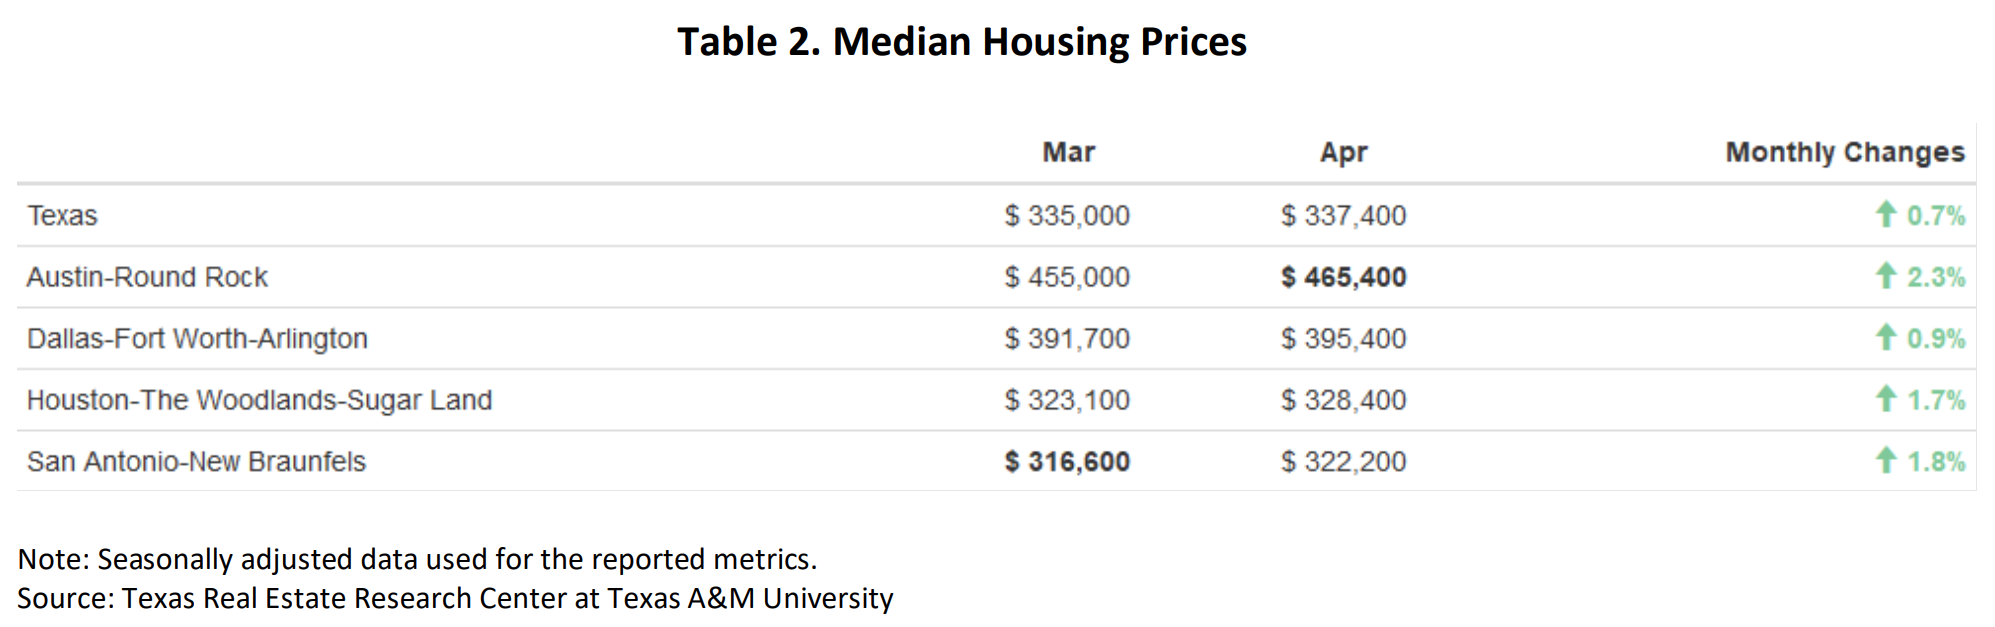
All measurements are calculated using seasonally adjusted data, and percentage changes are calculated month-over-month, unless stated otherwise.

April’s housing sales slipped uniformly in the Big 4 Texas metros. As buyers adjusted to currently inflated rates, the loss in sales was primarily due to the lack of home supplies as construction activities slowed and sellers’ unwillingness to give up their low rates. The higher mortgage rates put the brakes on the housing frenzy. Prices had been stable, fluctuating around 1 percent month over month (MOM) since November 2022. The housing market is forecasted to stay normalized until the economy sees relieved rates.
Supply Recedes After the Two-Year Boom
So far, 2023 single-family construction levels have fallen far below levels from the previous two years. April’s single-family construction permits registered 25 percent below April 2021’s level and even more than 2022’s. Year-to-date permit levels are about 46 percent below 2022’s. On the monthly basis, Dallas (3,617 permits) and Houston (4,238 permits) declined from March’s peaks. The ratio between Austin (940 permits) and San Antonio (750 permits) diminished after doubling a year ago, signaling a significant reduction of Austin’s real estate development amid the cooling housing market.
The number of new homes breaking ground remained low, although strengthened monthly since single-family construction starts bottomed out in December 2022 at a five-year low. April’s construction starts marched up to 10,080 units. Interestingly, while Dallas issued fewer construction permits than Houston, the metro had slightly more construction starts (3,242). Construction generally hits a seasonal low in December and peaks in March or June.
The state’s total single-family starts value reached $9.9 billion in April, down from $16.1 billion in April 2022. Houston and Dallas-Fort Worth continue to account for over half of the state’s construction activity values, holding a combined 55 percent of the Texas market. Austin and San Antonio remained on par with previous years’ market percentage shares. This capital allocation suggests metros still receive consistently proportional interests from prospective investors.
Active listings also reversed last year’s upward trend as the number of available homes, both new and existing, fell from a two-year peak in November 2022. The 7.8 percent MOM drop brought homes ready for sale down from 87,700 units to 80,850. As potential sellers pulled back amid higher mortgage rates, the number of new listings ticked down 10.5 percent from April 2022 to 36,800 units. Despite the drop in housing inventories, months of inventory (MOI) resumed an upward trend at three months. The trend was largely sustained by Austin’s increasing MOI.
Demand Softens as Sales Slump More than 10 Percent
The state’s seasonally adjusted total home sales dipped to 27,154 single-family houses in April, resulting in a 12 percent MOM decrease (Table 1). Monthly home sales across metros declined between 6.1 percent to 15.3 percent. Interestingly, among the four metropolitan areas, sales declined least in the priciest metro—Austin. One plausible reason was Austin’s already depressed demand, with sales volume vanishing at 18.8 percent year over year (YOY), down from 3,180 transactions in April 2022.

Sales fell across all price cohorts in Dallas and Houston except for homes priced above $750K, inching up 6.1 percent and 4.2 percent MOM, respectively. However, compared with a year ago, sales in this price category had plummeted more than one fifth in all metros amid higher mortgage rates. Overall home sales in Texas cooled 16.4 percent YOY in April.
Texas’ average days on market (DOM) steadily advanced to 58 days, gaining one day per month since February. Compared with the five-year average of 59 days before 2020, the housing market was only one day behind historical norms. Austin’s DOM kept inching up, marking 76.8 days in April, the longest market time since 2013. This is a major swing from the intense market conditions from a year ago.
The U.S. Census Bureau announced that Texas’ homeownership rate was 65.2 percent in 1Q2023, a boost from the 63.8 percent two-year average. Despite the increased ownership in the state, the number was still 1 percent lower than the national rate (66.2 percent) due in part to the influx of out-of-state movers. For the less populated metros, Austin and San Antonio had higher ownership rates at 65.1 percent and 68.2 percent, respectively. Meanwhile, the more populated metros had lower rates—around 61.5 percent in DFW and Houston.
Prices Make Minimal Gains as Long-Term Rates Moderate
Texas’ median home price inched up 0.7 percent MOM to $337,400, shying close to 3 percent from a year ago (Table 2). Austin’s price grew for the second consecutive month, rebounding 2.3 percent MOM. Despite the recent improvement, Austin’s median price still fell $83,000 short of April 2022’s record high, diminishing 15 percent. Other than Austin, the remaining three metros had some gains. Houston’s and San Antonio’s housing prices remained below the state average, making housing in the Texas Triangle relatively affordable.
Amid moderating consumer price growth, the ten-year U.S. Treasury bond retreated from a historical ten year high of almost 4 percent in October 2022, still attracting long-term investors with a high yield of 3.46 percent. Similarly, the Federal Home Loan Mortgage Corporation’s 30-year fixed-rate continued its downward course to 6.4 percent, down from 6.9 percent in October 2022.
The Texas Repeat Sales Home Price Index accounts for compositional price effects and provides a better measure of changes in single-family home values. In March 2022, Texas witnessed a record period when home prices appreciated by more than 20 percent in a year. However, since then, the rapid increase in mortgage rates has led to a significant slowdown in the growth of the price index. It dropped from a YOY growth rate of 19.8 percent YOY to 0.7 percent YOY. It is anticipated that home price appreciation will continue to moderate, and the last time the Texas index recorded a gain of around 0 percent was approximately twelve years ago, in July 2011.
The Texas Housing Affordability Index (THAI) reflects the relationship between the median-family income and the median-priced home. A higher THAI indicates relatively greater affordability. The relative data (Texas Housing Affordability Index) can be found on the Center’s website . Measured by the THAI metric for 1Q2023’s first-time homebuyers, Houston and Fort Worth-Arlington were most affordable between the major metros at 1.24. Following metros were San Antonio, Austin, and Dallas, respectively, with the latter two metros on equal footing at 1.1.
You might also like


How Natural Disasters Affect Homebuying Decisions
The combination of climate change and economic growth in disaster-prone regions increasingly exposes Texas’ population to extreme weather events (IPCC, 2023). Natural disasters have an immediate impact on economic activity and typically lead to net out-migration, decreased income, and lower real estate values (Boustan et al., 2020).

String of Perils
Breaking news: Insurance is complicated. This guide to the different types of perils, policy forms, and coverage types can help you better understand your choices for property coverage and make informed decisions.


