Between 2010 and 2030, Texas’ population will grow by 120 percent. Roughly 50 percent of that increase will be from people moving from other states or countries. The state’s labor pool, those from 18 to 64, will more than double. The fastest-growing age group, those 65 and older, is expected to increase by 259 percent.
Oct 8, 2013
The Amazing Rate, Part 2
Between now and mid-century, Texas’ population will grow at a dizzying rate. New residents will hail from elsewhere in the United States and from around the globe. Distributions of ethnic groups and age categories will shift significantly, resulting in a more diverse and older population.

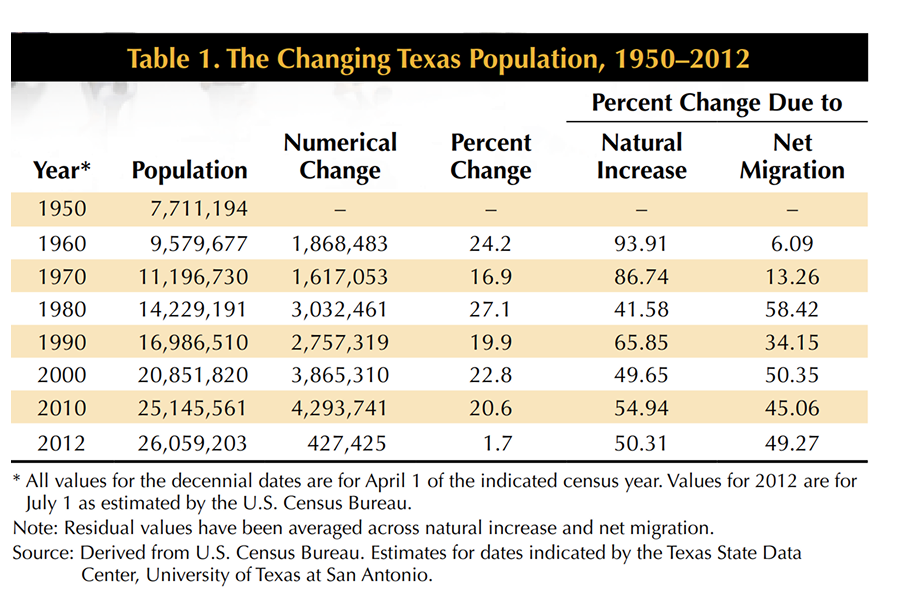
Net migration to Texas reflects the state’s appeal relative to other states and countries. During the 1950s and 1960s, Texas’ population grew almost exclusively from natural increase (births minus deaths). After 1970, domestic and foreign migration played an increasingly important role in the state’s population growth (except during the severe recession of the 1980s).
Between 2000 and 2010, net migration accounted for more than 45 percent of the total increase in population (Table 1). For the past two years, net migration from other countries and states is estimated to account for almost half the total population growth.

Texas ranked second in the country in domestic net in-migration (people relocating here versus going to another state) between 2000 and 2012 (Figure 1). Texas’ new jobs, faster economic recovery during the mid2000s, and relatively lower cost of living were major attractions.
The economic recession of 2007 and housing market collapse in other states, such as California, Florida, New York, Illinois and Michigan, caused many people to migrate to Texas. More than one million more people moved into Texas than left for another state between 2000 and 2012.
According to mobility data provided by the Internal Revenue Service, the majority of people coming to Texas between 2004 and 2010 were from five states: California, Oklahoma, Illinois, Louisiana and Florida (Figure 2). Migration to and from California and Oklahoma generally reflects the movement of energy industry personnel. In- and out-migration to Louisiana was spurred by Hurricane Katrina.

The major metros of Texas had similar infusions of population from net migration (Table 2). Like Texas, Dallas–Fort Worth and Houston derive their growth roughly equally from natural increase and net in migration. The majority of Austin’s and San Antonio’s growth comes from those moving there from out of state and out of country. Since 2010, domestic in-migration has increased substantially not only statewide but also in the major MSAs compared with the previous ten years.

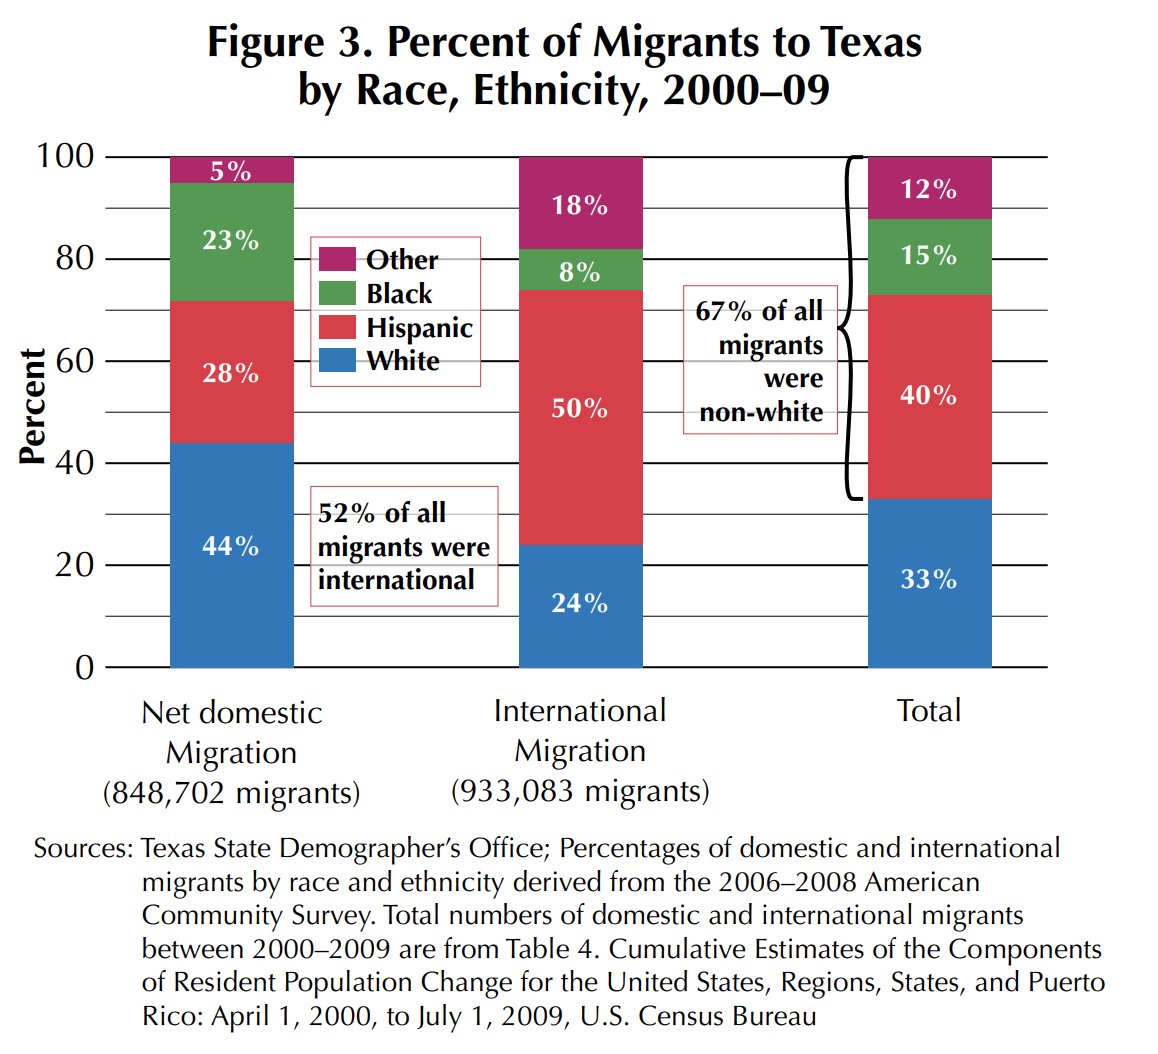
Domestic and international immigration to the state have contributed to racial/ethnic compositional changes (Figure 3). An estimated 52 percent of international immigrants to Texas from 2000–09 were Hispanic; 24 percent were Anglo/White; and about 18 percent were Asian and Other. By comparison, about 44 percent of domestic immigrants to Texas between 2000 and 2009 were Anglo/White; 28 percent were Hispanic; and 23 percent were Black. Roughly two-thirds of all Texas immigrants were non-Anglo.
Shifts in Age Distribution
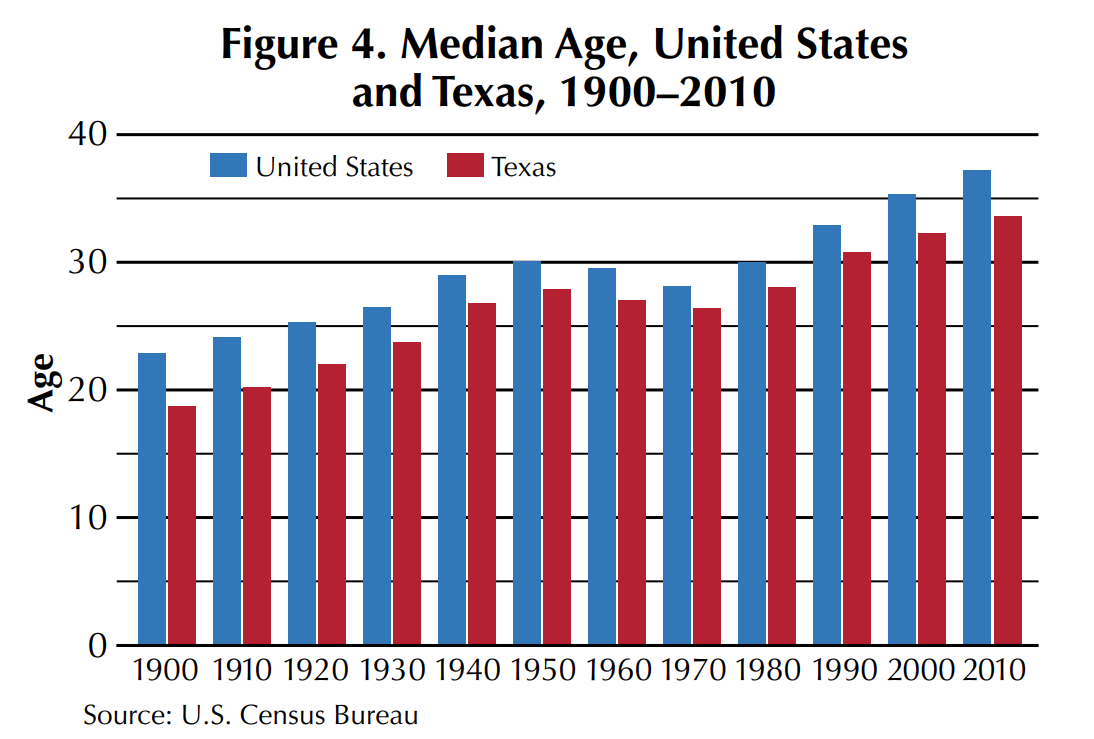
Texas has long been a “young” state compared with the rest of the country. In 2010, Texas’ median age was 33.6 compared with the U.S. median of 37.2 (Figure 4). Over the years, Texas’ median age has consistently been younger than the U.S. median. As people live longer and birth rates have stabilized, the median age for the country and for Texas has steadily climbed.
The state’s current and projected population distribution by race/ethnicity and by major age groups reveals several significant potential impacts. The projected population between 2010 and 2050 of the major age groups within the four major racial/ethnic groups indicates a substantial shift toward Hispanic and the Asian/Other categories for each age level (Table 3).

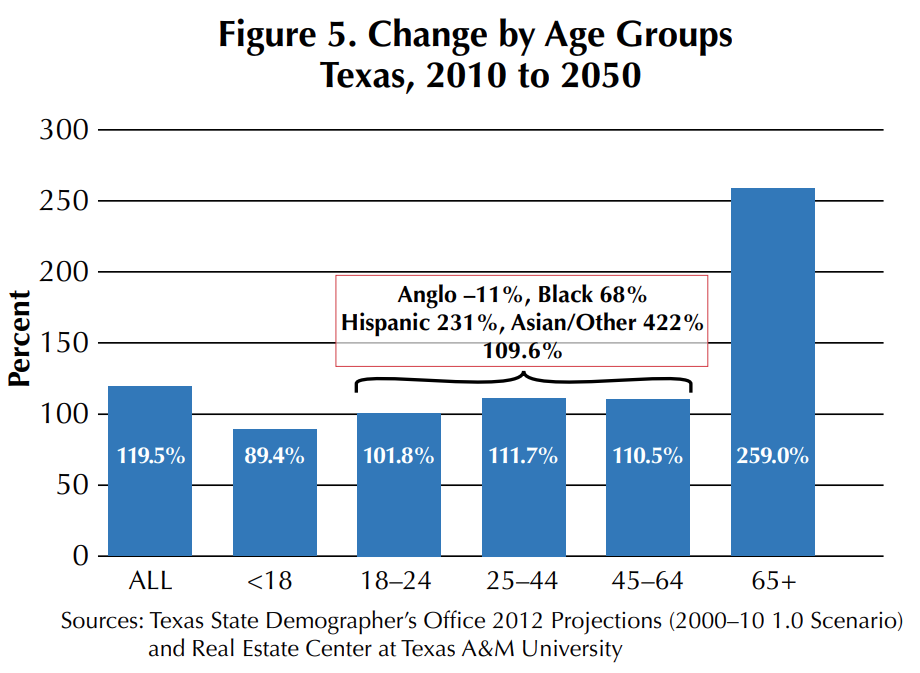

Between 2010 and 2050, Texas’ total population will increase an estimated 119.5 percent (Figure 5). The older-than-65 group will expand the most, and those younger than 18 will grow the least, although still almost doubling.
The number of people younger than 18, which represents the total potential school-aged population, is projected to increase from around 6.9 million in 2010 to slightly more than 13 million in 2050. The sheer numerical increase will put additional pressure on the overall education process and education-related resources statewide. As a percentage of the total population, the school-age group declines slightly from 27 percent to 24 percent because of the significant increase in the 65-plus group (Table 4).
The Anglo school-aged population is expected to decline from around 34 percent in 2010 to about 17 percent by 2050. Meanwhile, school-aged Hispanics will increase from 48 percent to 63 percent, and the Asian/Other category will grow from 6 percent to 12 percent.
The largest population age group is 18 to 64, which encompasses the total potential Texas labor force for the next 40 years. Summing the separate age groups in that range for each decade reveals that the potential labor force is expected to increase from approximately 15.7 million, or 62 percent of the total 2010 population, to 32.9 million, or 59.5 percent of the total 2050 population. Despite more than doubling during the period, the groups’ total percentage decline results from the huge change in the 65 and older age group.
In 2010, Anglos 18 to 64 years old numbered about 7.3 million or 47 percent of the total category; Hispanics numbered 5.6 million or about 36 percent. By 2050, Anglos aged 18 to 64 are projected to number 6.5 million or just 20 percent of the labor pool. By 2050, Hispanics are projected to increase to 18.6 million or 57 percent of the total, while the Asian/Other segment will reach 4.7 million, 14 percent of the total.
This age segment of the state’s population will not only supply the labor pool but also the economic energy for consumer spending, home buying, auto purchases, tax payments and the overall socioeconomic activity and health of Texas. Moreover, it will have a large say in the social and political future of the state, exerting its will through absolute number and through the ballot box.
Between 2010 and 2050, the fastest-growing population segment will be the 65-plus age group. This group is expected to increase a whopping 259 percent, far outpacing the 120 percent increase in the total population over the same period. The retired/elderly population segment of the total population will expand from about 2.6 million or 10 percent of the total population in 2010 to 9.3 million or 17 percent of the total by 2050.
The implications of this group’s expansion on healthcare, housing, consumption and local taxes, as well as social and political attitudes and public service demands will be manifested in multiple ways. As with the other age groups, the composition of this group in 2050 will be much different than in 2010.
Currently, Anglos make up 68 percent of the population 65 and older, and Hispanics account for 20.5 percent. By 2050, however, Anglos will decrease to 36 percent of the age group while Hispanics will increase to 43 percent. The Asian/Other segment will increase from 3.5 percent to 11 percent of the age group.
The rush of new residents will bring wholesale changes to the social, political and economic fabric of the state. Many current problems and issues that seem pressing will be exacerbated by more people — education, transportation, water resources and taxes, just to name a few. The one thing that seems abundantly clear is that the faces of Texans in the future will be very different from the Texans of the past.
Dr. Gaines ([email protected]) is a research economist with the Real Estate Center at Texas A&M University.
Did you like this Article?
You might also like

6 minute read
Jul 10 2013
The Amazing Rate
With its population projected to grow by 30 million between now and 2050, Texas is a shoo-in to win any growth rate competition. Think of it as a race from now to the future, during which the state is sure to encounter challenges. Not the least of these will be housing all those folks.


Demographics & Population
4 minute read
Feb 21 2019
The New Texans
In recent years, Texas has welcomed a steady flow of international immigrants—not just from Mexico but from as far away as India, China, and the Philippines. Read how these new neighbors are changing the face of Texas and brining diverse skills to the workforce.


