Texas Housing Insight | September 2025
Housing market cycles are typically marked by prices and sales volume moving in the same direction. That said, recent market indicators point to a divergence from the usual pattern in the Texas housing market.


Housing market cycles are typically marked by prices and sales volume moving in the same direction. That said, recent market indicators point to a divergence from the usual pattern in the Texas housing market. Since midsummer, while home prices have declined at an accelerated pace, sales activity remains resilient. Elevated inventory levels and excess supply have created buyer-friendly conditions, driving up transaction volume even as prices declined, underscoring a market in transition.
September posted strong year-over-year (YoY) sales growth, surpassing the pace seen during the peak spring and summer homebuying season. On a seasonal basis, it also registered one of the smallest month-over-month (MoM) slowdowns between August and September. The forward-looking indicator, pending home sales, points to continued momentum in rising sales activity through October.
Home prices continue to decline broadly. Statewide, average home prices fell for a third consecutive month with a nearly 1 percent YoY drop. Declines are more pronounced in Austin, Dallas-Plano-Irving metropolitan division, and San Antonio. Even Houston, a city that did not see extreme pandemic-era price spikes, has come under pressure from elevated inventory levels.
Inventory has eased slightly from its July peak amid slowdown in new listing activity, yet it remains near record highs. This elevated and persistent supply pressure continues to tilt the market in favor of buyers, contributing to rising sales while dampening prices. In September, seller price concessions reached unprecedented levels, with the median asking price reduction climbing to $17,000, roughly equivalent to 5 percent off the asking price.
While falling mortgage rates and supply-side pressure, including high inventory of new construction, have helped draw buyers back into the market, overall demand remains constrained, particularly within the middle-tier price segment, which represents most potential housing activity. With over 80 percent of mortgaged homeowners locked into rates below 6 percent, discretionary demand from existing homeowners is likely to remain limited under the current interest rate environment.
Buyer Demand Remains Resilient

Notes: The sales numbers reflect actual sales, not seasonally adjusted.
Source: Texas REALTORS and National Association of REALTORS data (accessed at Haver Analytics)
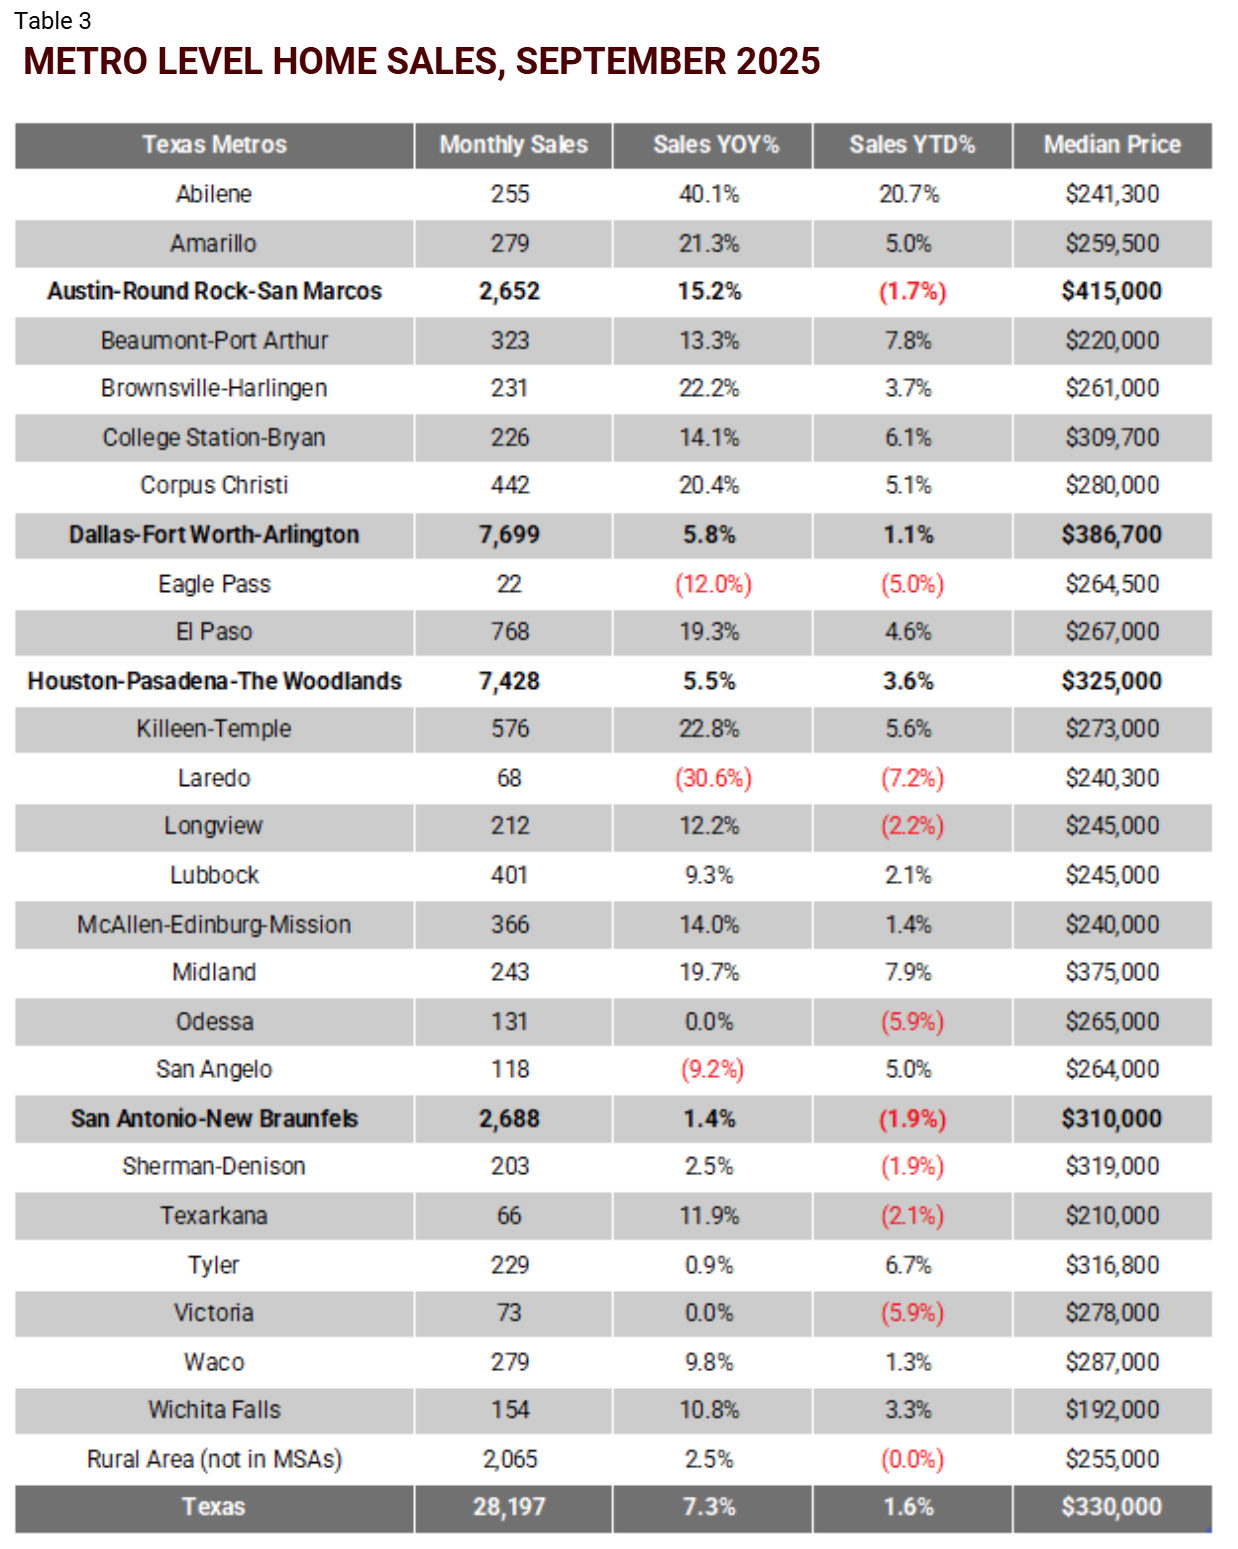
- September marked the fourth straight month of solid YoY sales growth at a pace exceeding prior months. YTD, home sales grew 1.6 percent, up from 1 percent through August.
- Pending home sales were up 2.8 percent YoY, signaling sustained momentum through October.
- September’s median home prices were $330,000, down from the previous month ($335,000) and a year ago ($336,500).
- Nationally, seasonally unadjusted home sales surged 8.2 percent YoY, while YTD sales still trailed 2024 levels by 0.2 percent. The median home price of existing single-family homes was $415,200, down from $422,400 in August.
- (Not shown) All regions recorded rising sales YoY: the Northeast at 4.7 percent, Midwest 6.2 percent, West 6.5 percent, and 11.1 percent in the South. YTD, sales were down 2.6 percent in the West, flat in the Midwest (down 0.1 percent), and up 0.8 percent in the South and 1.4 percent in the Northeast.
Monthly Market Snapshot: September Sales and Inventory Trends

Notes: The turnover rate is calculated as pending sales divided by inventory, where inventory is the average of month-beginning and month-end inventory
Source: Texas Real Estate Research Center analysis of Data Relevance Project and Texas REALTORS data
- In September, homes sold averaged 67 days on the market, resulting in an inventory turnover rate of 17.5 percent—down from 20.6 percent a year earlier. In the relatively balanced pre-pandemic market, the turnover rates for the month of September averaged 25 percent.
- September’s median seller price cut climbed to $17,000, compared to $13,000 a year earlier. In percentage terms, it amounted to 5 percent off the asking price, or a sale-to-list price ratio of 0.95.
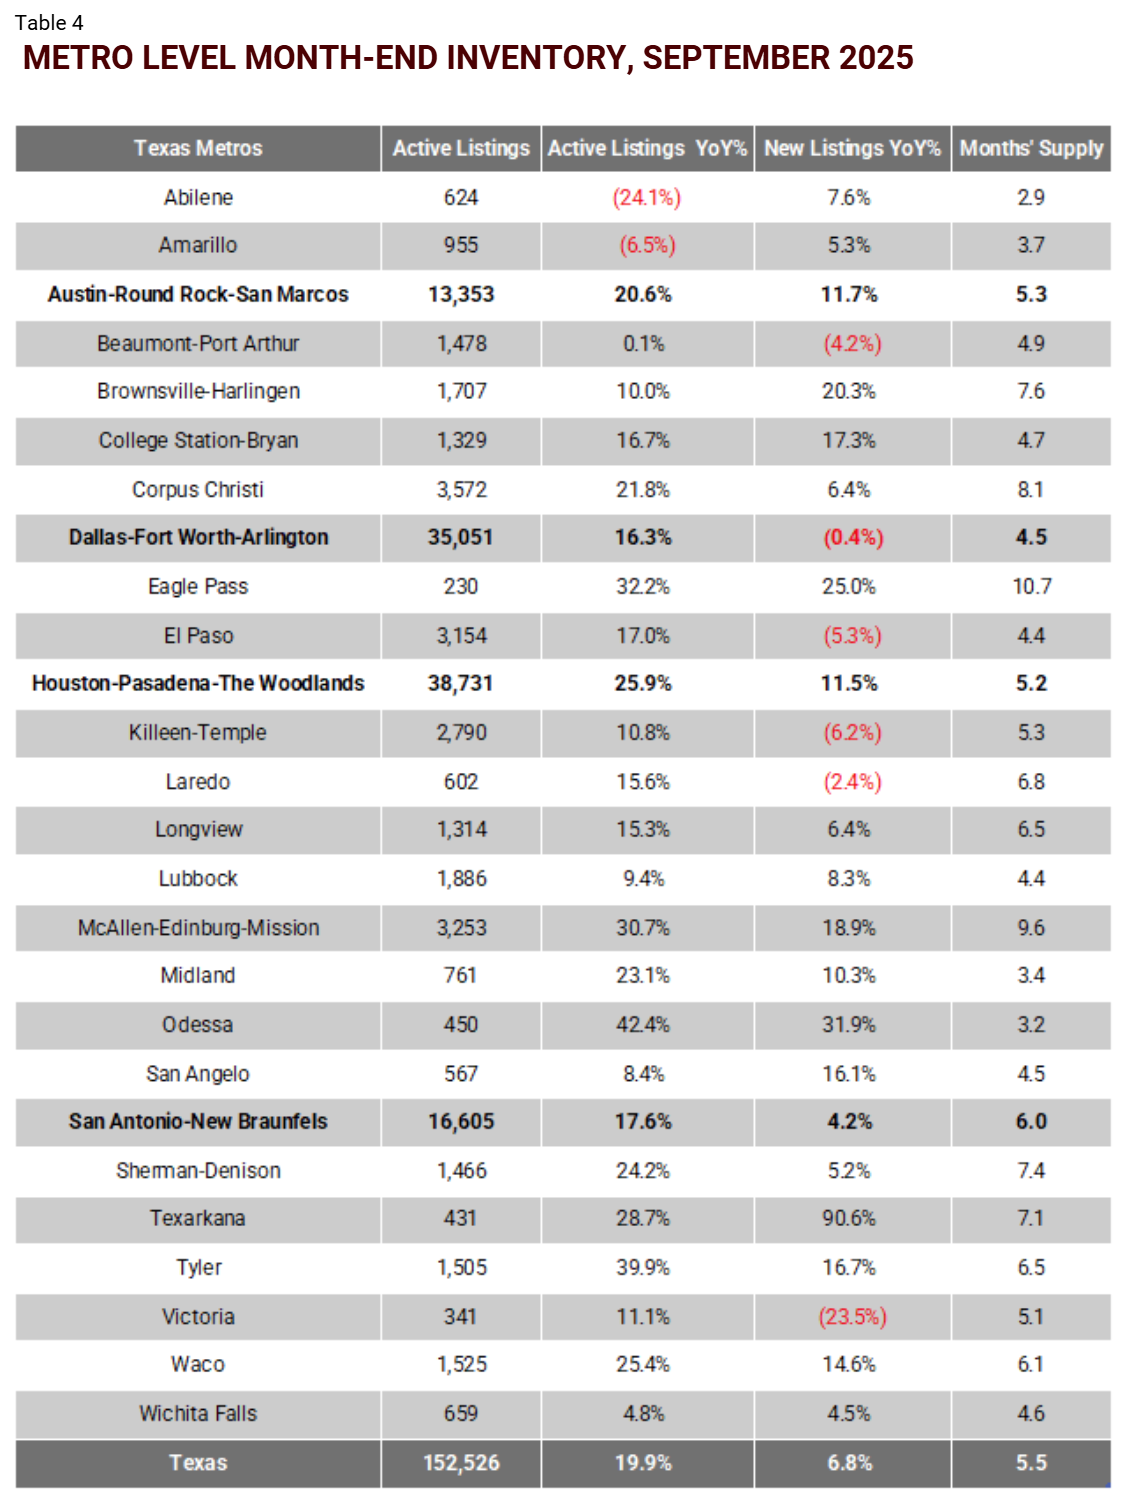
- As of September, inventory is at a 5.5-month supply. In Texas, a three- to four-month supply is generally considered indicative of a more stable and balanced market.
- Active, unsold listings have sat on the market for an average of 96 days, compared to a 67-day average for properties that have sold.
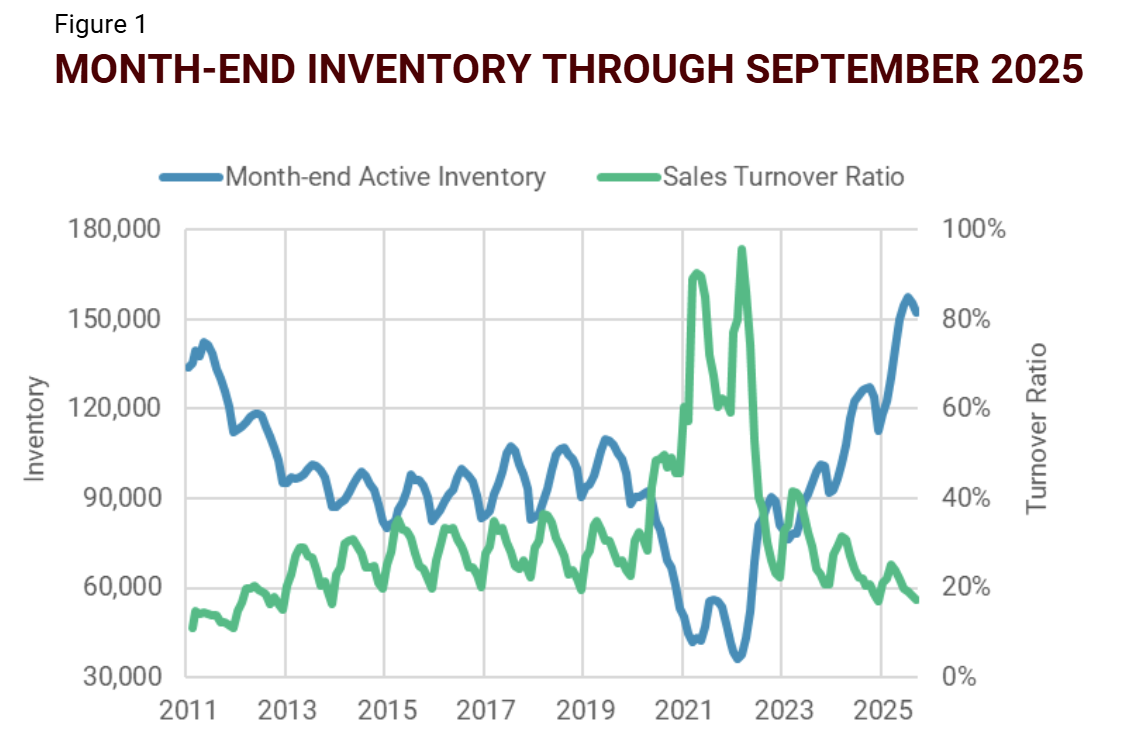
Housing Inventory Is Holding Near Record Highs
Since midsummer, active inventory has eased from its July peak as new listing activity slowed heading into the fall and winter. However, overall housing supply inventory remains near record highs even as growth has leveled off.
Source: Texas Real Estate Research Center analysis of Data Relevance Project, Texas REALTORS data
- September’s month-end inventory is down 3.4 percent from July and 2.1 percent from August.
- Despite inventory growth levelling off, active inventory rose 20.2 percent YoY, totaling 152,292.
- Inventory turnover ratio has reached a 12-year low at 17.5 percent, translating into less than 1-in-5 listings that became pending during the month. Before the pandemic, the normal rate of inventory turnover fluctuated at around 30 percent.
- (Not shown) New listings fell sharply from their May peak, declining by as much as 23.4 percent. Since August, they have slowed by an additional 5.8 percent. However, new listings were 6.6 percent more active than a year ago.
Sales Activity Is Weakest In The Broad Middle Market Segment
Muted sales activity in the broad middle market reflects a key reality that millions of existing homeowners are locked into low mortgages, making them reluctant to move and trade for homes with significantly higher mortgage rates.

Source: Texas Real Estate Research Center analysis of Data Relevance Project and Texas REALTORS data
- While overall sales activity has remained resilient, divergent trends have emerged across different price tiers.
- Sales momentum was strongest in the low end (below $250,000) and high end (above $800,000) of the market, while activity in the mid-range segment ($350,000 to $800,000) lagged.
- In September, entry-level home sales (below $250,000) surged 13.9 percent, followed closely by the top-tier segment with a 13.7 percent YoY rise. Affordable starter homes priced between $250,000 and $350,000 also posted a modest 5.9 percent annual gain.
- Sales in the $350,000 to $600,000 price range declined 8.1 percent YoY, following modest decreases in July and August. This “move-up” segment, which represent the largest share of buyer demand, saw the weakest activity. Since mid-2022, it has accounted for over 31 percent of all home sales in Texas.
Texas Home Prices Fell Again In September, Pace Broadly Picks Up
Under persistent supply pressure, Texas home prices continue to weaken broadly. September recorded the third consecutive months of negative YoY price change, led by Austin, Dallas-Plano-Irving metropolitan division, and San Antonio.

Source: Texas Real Estate Research Center analysis of Data Relevance Project and Texas REALTORS data
- Statewide, home prices dropped 0.8 percent YoY, with the pace of price depreciation accelerating from 0.4 percent in August and 0.3 percent in July.
- Austin continues to lead in price declines, though the pace has eased slightly since midsummer. In September, the city’s median sales price was $415,000, down from $425,000 a year earlier.
- The DFW area recorded a 1 percent annual price decline, led by a 1.8 percent drop in the Dallas-Plano-Irving metropolitan division. Prices in the more affordable Fort Worth-Arlington-Grapevine metropolitan division remained relatively stable through September.
- Home prices in the Houston area have also come under pressure from elevated inventory pressure, accelerating the pace of annual declines. In September, prices fell 1 percent YoY.
- San Antonio also experienced notably price softening, with a 1.9 percent YoY drop in September, following a 1 percent decline in August.
Local Housing Market Indicators
Source: Texas Real Estate Research Center analysis of Data Relevance Project and Texas REALTORS data
Source: Texas Real Estate Research Center analysis of Data Relevance Project and Texas REALTORS data

Notes: Permit value is builder estimated construction costs of the residential structure, excluding land acquisition costs.
Source: Survey of New Construction of U.S. Census Bureau
You might also like


How Natural Disasters Affect Homebuying Decisions
The combination of climate change and economic growth in disaster-prone regions increasingly exposes Texas’ population to extreme weather events (IPCC, 2023). Natural disasters have an immediate impact on economic activity and typically lead to net out-migration, decreased income, and lower real estate values (Boustan et al., 2020).

String of Perils
Breaking news: Insurance is complicated. This guide to the different types of perils, policy forms, and coverage types can help you better understand your choices for property coverage and make informed decisions.


