Home in the Range
Housing markets are divided into segments based on what percentage of all sales fall into which price brackets. Texas’ markets consist of three segments, two of which are growing and a third that’s declining.

Texas’ housing market comprises homes priced from less than $10,000 to several million dollars. The home price differential has divided the state’s residential real estate market into several market segments according to price brackets. The shares of these segments in total homes sold gradually change over time in response to changes in income and consumer preferences.
Growing incomes and prosperity are usually reflected in higher growth rates of shares of higher-priced homes sold. However, socioeconomic factors and business cycles also impact market shares of different home price brackets. For instance, elderly or retired persons often prefer smaller, lowerpriced homes that are more easily maintained.
Ordinarily, the housing market is made up of two broad segments: a growing segment and a declining one. Growth is measured by the shares of homes sold in each segment as a percentage of total homes sold. The distribution of the percentages of homes sold is divided into two segments by a home price line. In a growing economy, the market shares of houses with prices above (or below) the price line increase (or decrease).
Real Estate Center research on the market shares of homes sold in Texas found that currently the state’s housing market comprises three market segments: two growing segments and one declining.
Before and After Housing Crisis, Great Recession
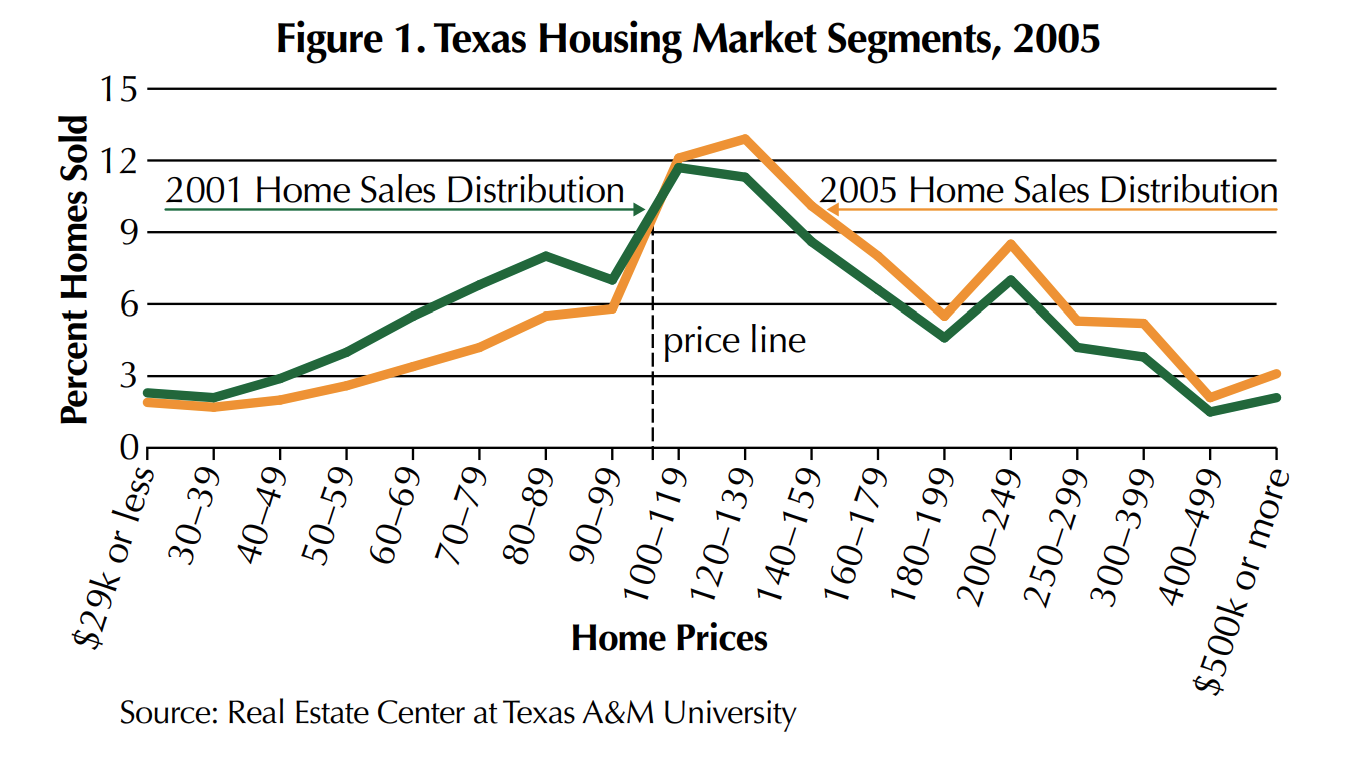
Overlaying the graph of 2005 distribution of homes sold on 2001’s graph shows the two graphs intersect at the $90,000–$100,000 price bracket (Figure 1). The price-line dividing the market into two segments is about $98,000. That is, homes with prices above (or below) $98,000 were increasing (or decreasing) their market shares from 2001 to 2005. The graph shows that the state’s housing market consisted of two market segments before the housing crisis that began in 2006.
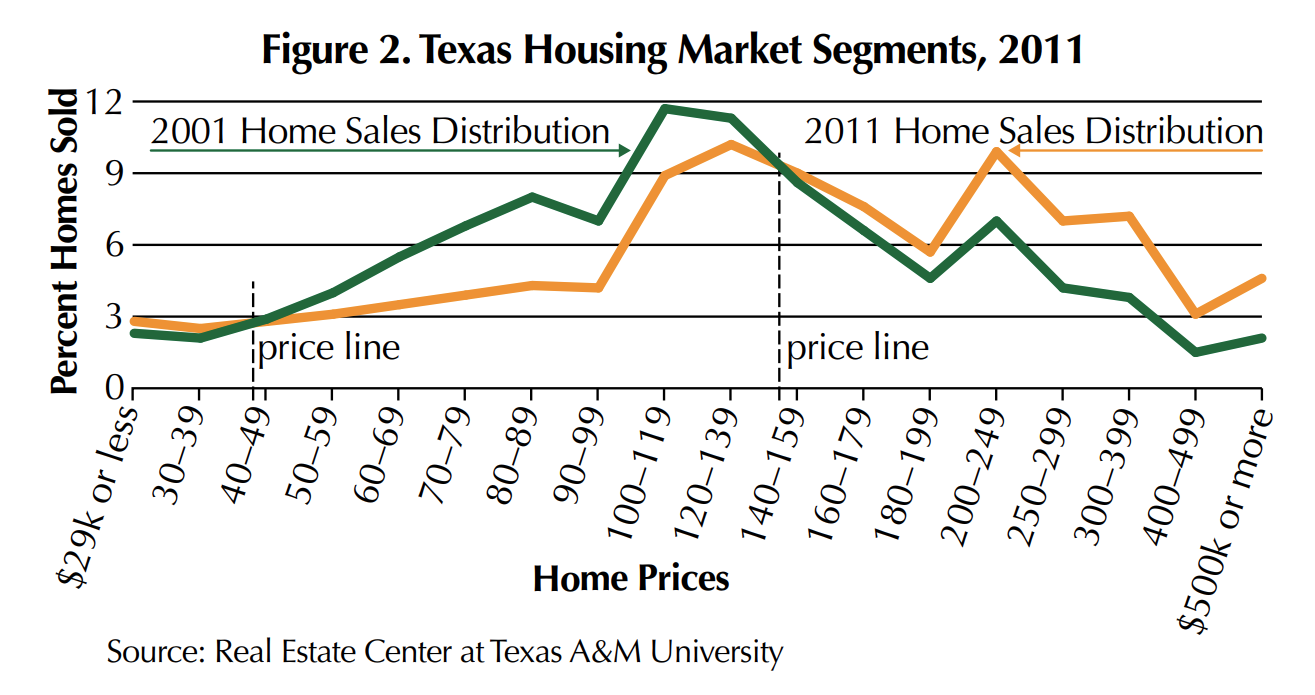
Overlaying the 2011 distribution of homes sold on 2001’s graph shows the two intersect at the $30,000 $40,000 and $120,000–$140,000 price brackets (Figure 2). The price-lines dividing the state’s housing market into three segments are about $38,000 and $138,000; that is, homes priced less than $38,000 and homes priced above $138,000 are increasing their market shares (Figure 2).
Transformation of the state’s housing market from two-segment to three-segment began with the housing crisis and the Great Recession in its aftermath (Figures 3.1 to 3.18). Homes priced less than $70,000 were losing market share until 2006; since then the trend has reversed (Figures 3.1 to 3.5). The market share of homes sold in the $70,000–$119,999 price bracket have been on a continual downward trend from 2001 to 2011 (Figures 3.6 to 3.9). Market shares of homes sold in price brackets from $120,000–$199,999 were increasing until 2006 and since then have trended downward (Figures 3.10 to 3.13).
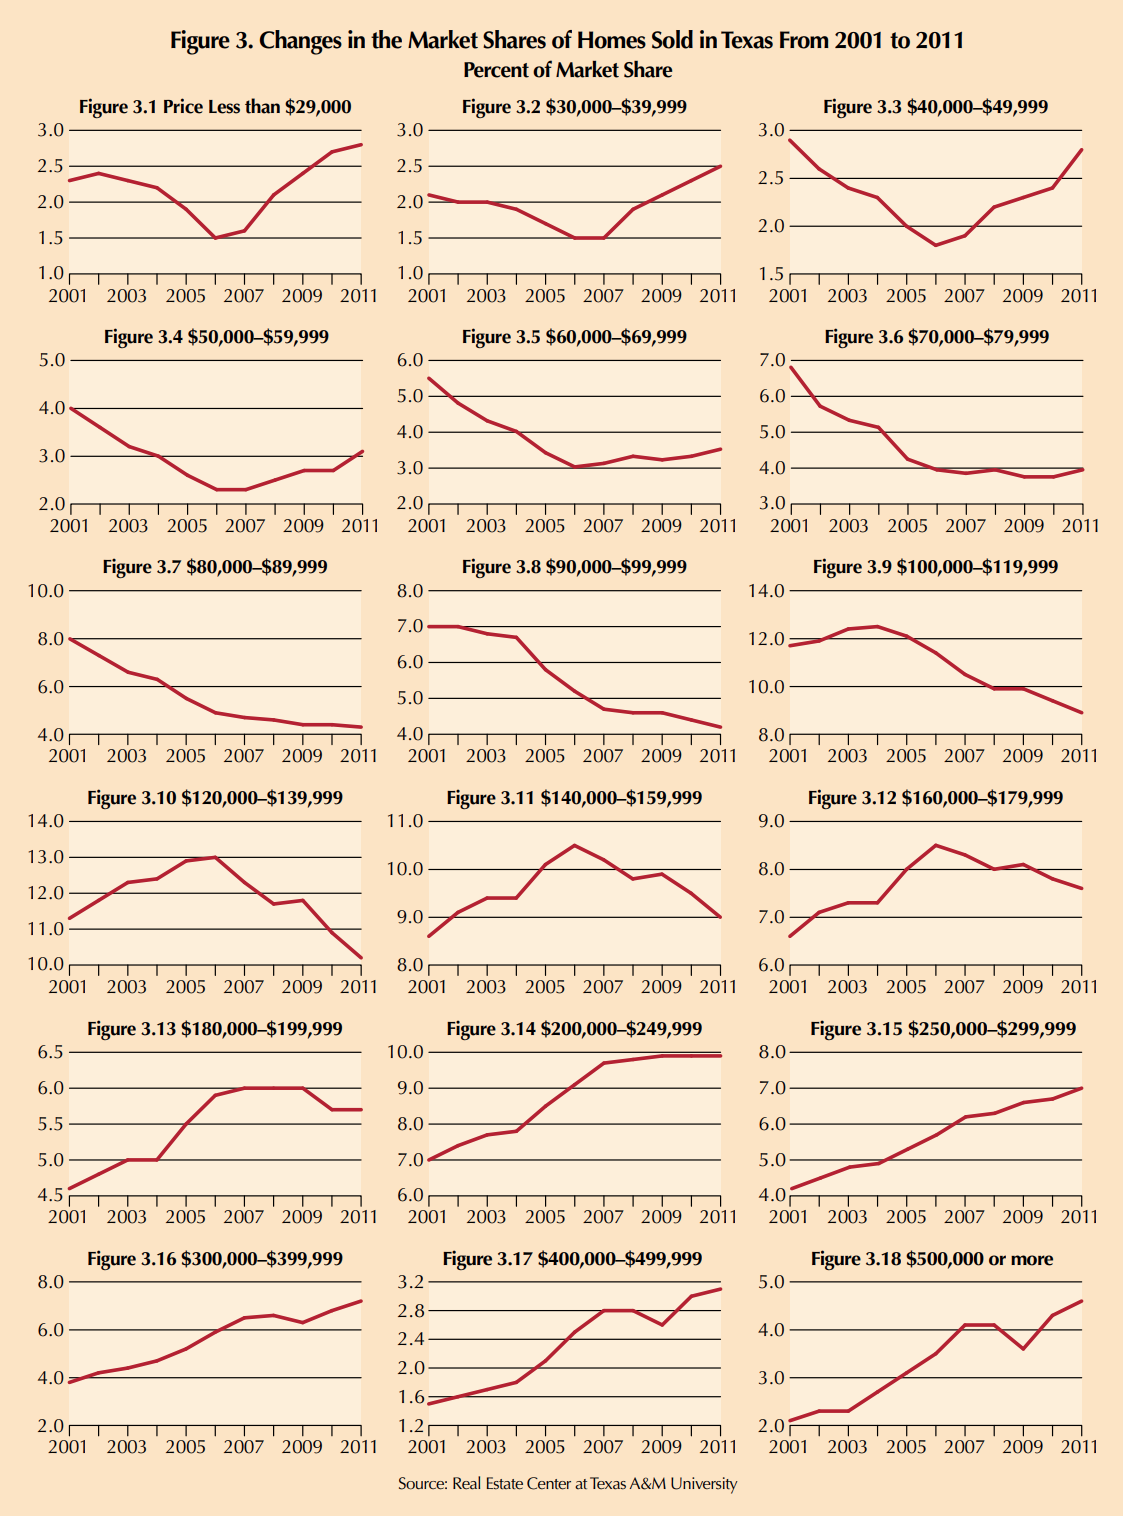
The most solid residential market segment comprises homes with prices higher than $200,000 (Figures 3.14 to 3.18). The market share of homes sold in this segment has increased every year since 2001. Shares of homes sold with prices of more than $300,000 fell briefly in 2009 but soon recovered (Figures 3.16 to 3.18).
Data and Methods
T he datasets used in this study consist of distributions of homes sold in different price brackets in Texas each year from 2001 to 2011. The distributions were constructed by computing the percentages of homes sold in 18 price brackets (see table). Similar distributions of homes sold are computed for the state’s metro areas. To analyze changes in the market shares of homes sold in different market segments over a specified period, the graph of price distribution of homes sold in the last year of the period is overlaid on the first year’s graph. The points of the intersections of the two graphs show price-lines dividing the total market into growing and declining market segments. Then, changes of market shares of each market segment over time are graphed to see the impact of business cycles on each segment’s market share.

Market Segments in Texas Metros
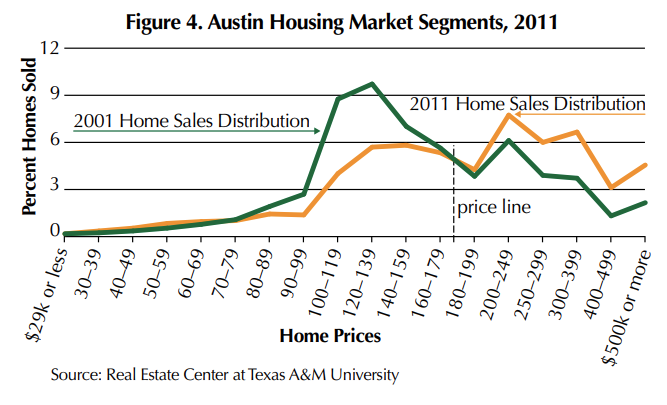
Current housing market segments for the state’s major metropolitan areas are shown in Figures 4 to 8. In Austin, homes priced less than $90,000 did not have a significant market share in total homes sold from 2001 to 2011 (Figure 4). Currently, homes priced more than $160,000 are gaining larger market shares of homes sold. The market share of homes in the $90,000–$159,999 price bracket has significantly declined from 2001.


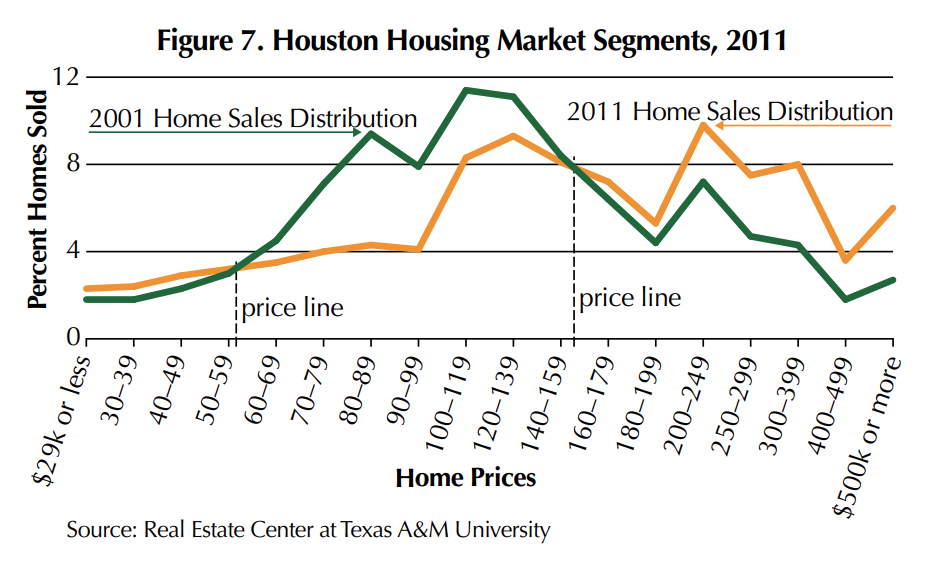
Housing markets in Dallas, Fort Worth and Houston are currently three-segment markets (Figures 5, 6 and 7). In Dallas, the market shares of homes sold with prices more than $170,000 or less than $60,000 are increasing as homes with prices between $60,000 and $170,000 decline (Figure 5). In Fort Worth, the market shares of homes sold with prices higher than $96,000 or less than $33,000 are expanding at the expense of homes with prices between $33,000–$96,000 (Figure 6).
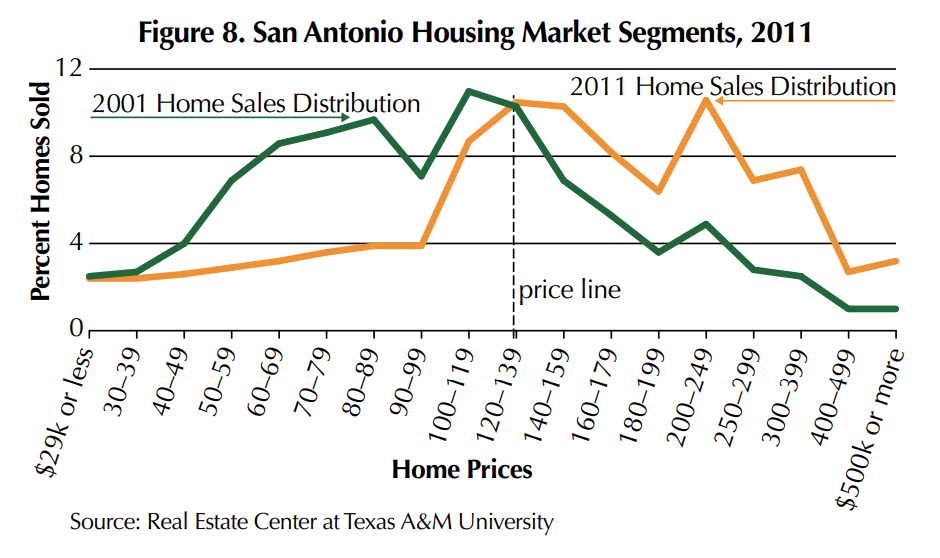
In Houston, market shares of homes sold with prices more than $140,000 or less than $50,000 are increasing while homes with prices between $50,000–$140,000 are decreasing (Figure 7). San Antonio’s housing market is a two-segment market with a home price line of $120,000 dividing the market (Figure 8). Market shares of homes with prices more than $120,000 are expanding while those with prices less than $120,000 are not.
The coincidence of an emerging, growing market segment for lower-priced homes in Texas along with the nationwide housing crisis and the Great Recession suggests that growing sales in lower price brackets may be attributable to foreclosures or the resurgence of the market shares of rental housing units (Figure 3).
This type of analysis helps brokers and salespeople identify the growing sections of the local housing market. For example, the resurgent growth in lower priced homes may dictate new strategies to sell these properties or develop a property management capability to manage rental property. Similarly, if certain price segments are declining, it may be prudent to reduce marketing and advertising and refocus resources on growing sectors of the price spectrum.
Dr. Anari ([email protected]) is a research economist with the Real Estate Center at Texas A&M University.


