Texas Land Market Developments, Third Quarter 2008
Through 2007, Texas land prices soared to 224 percent of the 2002 price. That’s a compound growth rate of 17 percent annually. Early 2008 reports indicated prices continued the upward trend but at a slower pace than 2002-07.

Executive Summary
- Typical tract size increased to 95 acres, up from 80 acres in 2007 but still below the 100 acres posted between 2003 and 2006.
- The price increase moderated to 7 percent, up from $2,174 per acre through the third quarter of 2007 to $2,315 per acre in 2008, slightly more than a third of the 20 percent growth for all of 2007. The third-quarter price per acre increased 6 percent from the 2007 full-year price of $2,190 per acre.
- Prices rose most strongly in Panhandle areas dominated by cropland.
- Volume of sales appears to have slowed in the first three quarters of 2008 with 4,841 completed sales reported compared with the 2007 third-quarter volume of 6,399 sales. That represents a 24 percent drop.
- Buoyed by high commodity prices and generous yields, the 2008 market saw continuing strong interest in cropland among investors and farmers. However, as the year progressed, commodity prices softened and investor interest appeared to be cooling.
- Some observers see weakness in sales of working livestock operations because of high feed costs. Recreational demand seems to be waning in some areas.
- Regional median prices increased in all land market areas with statistically significant price changes, ranging from 7 percent in Hill Country–North (LMA 14) to 78 percent in Panhandle–North (LMA 1).
2008 Land Prices
Through 2007, Texas land prices soared to 224 percent of the 2002 price (see Figure 1). That change amounts to a compound growth rate of more than 17 percent annually. Early 2008 reports indicated that prices continued the upward trend but at a slower pace than from 2002 to 2007.

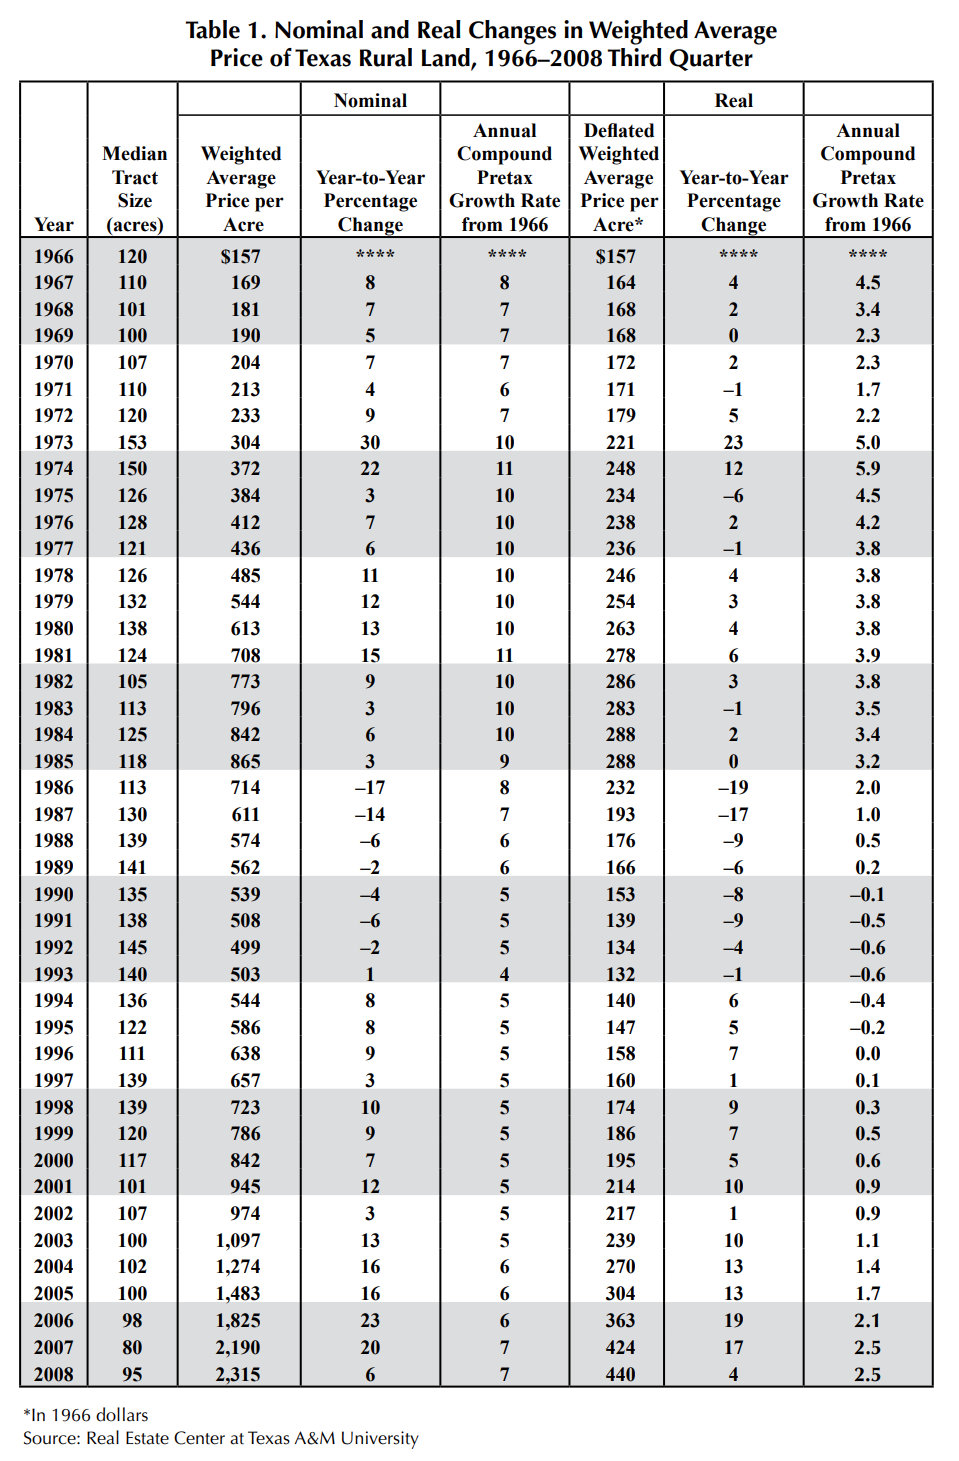
The 2008 statewide price moved 6 percent higher than the 2007 year-end overall price, rising from $2,190 to $2,315 per acre (See Table 1). The third quarter median price amounted to a 7 percent increase over the 2007 third quarter price of $2,174 per acre.
The fading growth rate suggests that 2008 price increases will likely be modest by year’s end. In fact, the second quarter 2008 median price failed to exceed the second quarter 2007 median price, the first time quarterly medians have fallen short of previous quarterly prices in many years. Although the strong upsurge in the first quarter ensured an increase for 2008, the financial turmoil roiling the economy during the fall suggested growth would fall substantially short of the 20 percent posted in 2007. Still, regional markets continued to display increasing prices on a broad front.
The real or inflation- adjusted price of $440 per acre in 1966 dollars pushed past the 2007 record level of $424 marking a 4 percent increase over the 2007 annual price. Nominal prices shown in Figure 1 reflect actual prices paid while real prices are nominal prices adjusted for inflation.
Tract Size
Tract size rebounded to 95 acres in first half 2008 (see Figure 2) compared with the historic low of 80 acres in 2007. Although markets had hovered in the 100-acre range from 2000 through 2006, the 2007 median size indicated a market focused on smaller sales.

Sales Volume
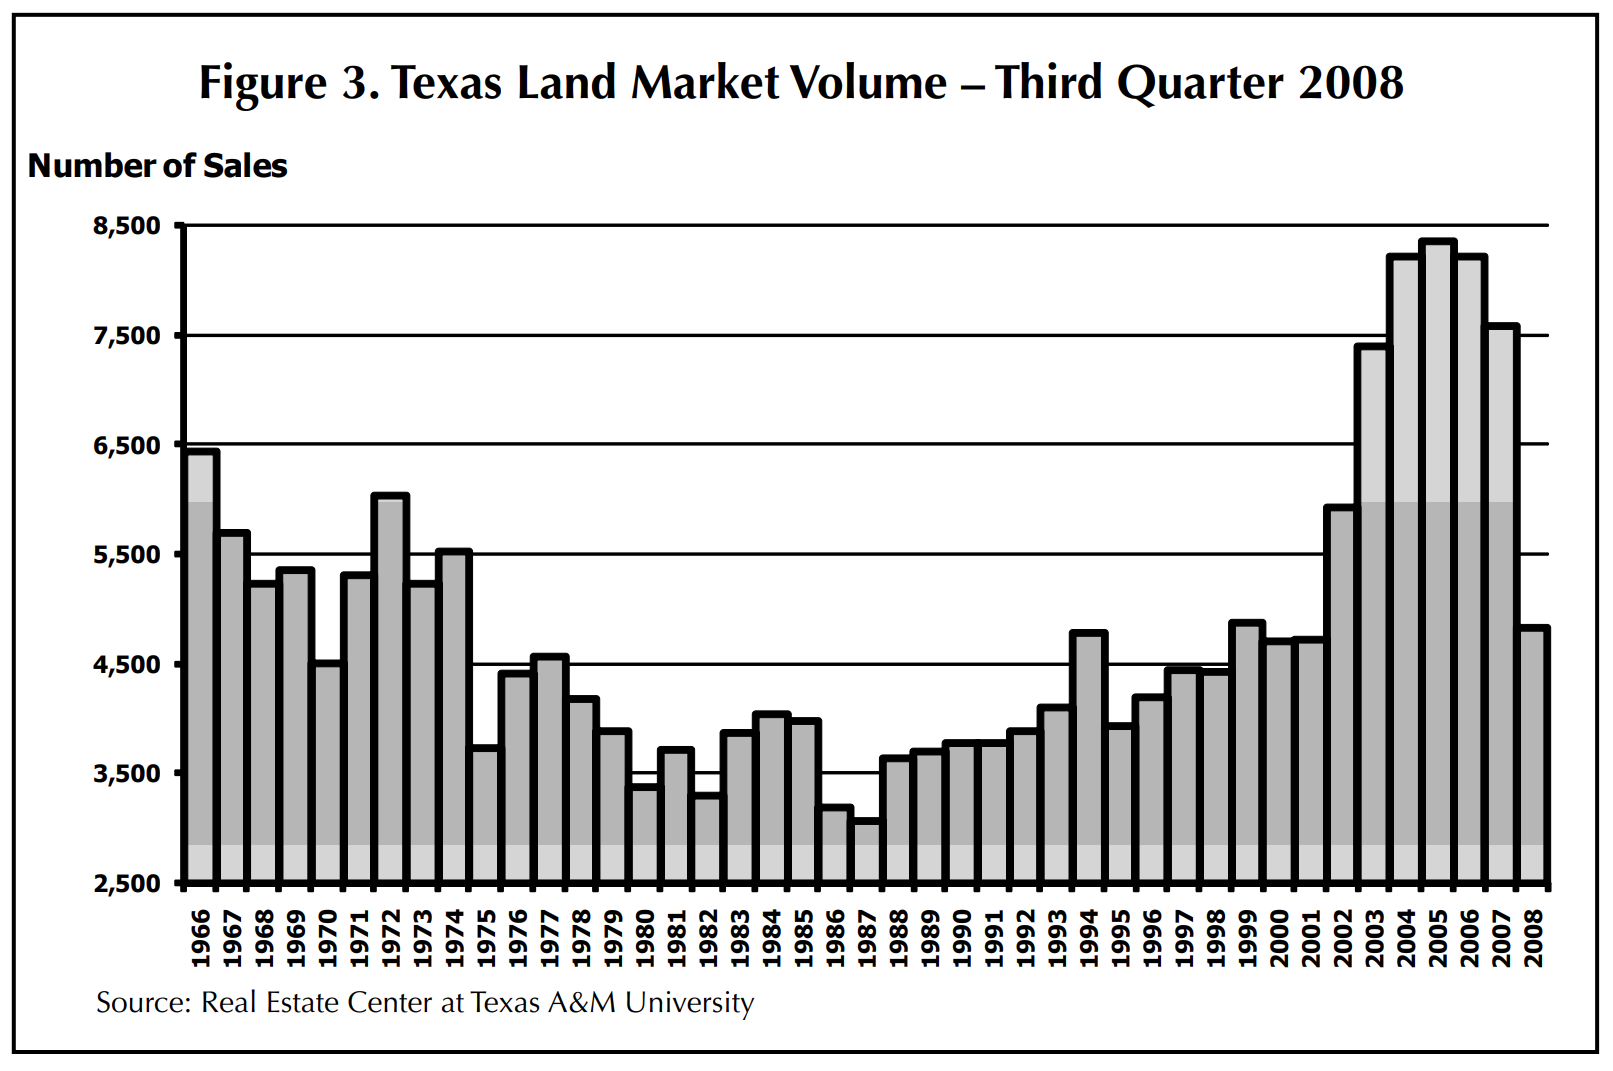
Activity slowed in 2008 with sales volume dropping to 4,841 transactions during the first nine months of the year (see Figure 3). Volume through the third quarter of 2007 was 6,399, more than 24 percent greater than the 2008 level of activity. The current level of sales would return Texas to 2002 volume levels.
Future Trends
Land markets tend to change with a whimper, not a bang. The typical dynamic is a dwindling activity level with weakly rising prices as buyers concentrate on fewer high-quality properties, leaving the more ordinary offerings to languish. Initial 2008 Texas sales reports revealed that those conditions held true in many areas of the state.
Overall, land prices continued to rise through the first three quarters of the year even as the number of transactions declined. In a quarter-to-quarter comparison, however, third quarter prices failed to exceed 2007 third quarter prices. That negative result caused the rate of increase in year-to-date price comparisons to slow from 14 percent in the first quarter to 7 percent in the third quarter. Volume of sales lagged 24 percent behind 2007 levels. Land market professionals report the number of ranchland sales dropping 30 percent or more with commercial land sales in the some urban areas falling by even larger margins.
They also report buyer resistance to asking prices with some sellers seeing no activity despite marking prices down. Still, median prices are rising in many locales and across the state.
Traditionally, uncertainty in financial and investment markets compels individuals to seek a safe haven for their capital. Tangible assets have long been a preferred vehicle, so worried investors may consider land as an option in the current environment, just as they did after 9/11.
However, some of those buyers are beginning to suspect that they are buying in at the top of the market. Owners who harbor similar judgments about future land prices have listed their holdings at today’s high prices.
Given past market dynamics, these market participants’ concerns may be well founded. In the 40-year history of the Center’s land market research, overall prices have tracked personal income very closely. A recession that stalls or reverses Texas personal income poses a substantial threat to land prices.
True, Texas is performing much better than the rest of the nation, and personal income is still increasing. But danger lies ahead. If the national recession drags Texas into its vortex of declining activity, land markets probably cannot avoid the painful realities already playing out in the residential market. The extent of exposure lies partly in the financial strength of current owners.
In the 1980s, the broad use of leverage made owners vulnerable to an economic downturn. Leveraged buyers defaulted on loans and new buyers abandoned the markets. Foreclosed land flooded into acquired property inventories at various financial institutions, and the rest is history. Prices dropped 30 percent from 1985 through 1987 and continued their lackluster performance for five more years, causing another 12 percent decline.
Conventional wisdom holds that today’s buyers are using much less leverage, perhaps indicating that they are less apt to abandon their land. However, no reliable statistics exist to document the amount of leverage supporting current Texas land markets. One thing is certain: various Farm Credit Associations and a number of commercial banks have been active in the markets. Someone must have been borrowing those funds.
Ultimately, these factors have created an atmosphere more fraught with risk for land buyers than at any time in the past decade. The significant economic downturn suggests that at best prices may stagnate or at worst lose the remarkable gains made in the past few years. Analysis indicates that current land prices may be as much as 30 percent greater than the level suggested by extending the trend established during the 1992–2003 recovery.
It has been evident for quite some time that the unprecedented 17 percent annual appreciation rate in Texas land markets from 2002 to 2007 cannot continue. Sales may halt or dwindle to a trickle with moderating or sliding prices.
Funds invested in land may become stranded if owners are unwilling to drop asking prices should this economic malaise maintain its grip for an extended period. Owners cannot expect to be able to extract their capital should they need funds for other investments and activities.
The potential for a long-term correction in land markets has increased substantially with the chaos in financial markets. Such a correction could eventually translate into stable or declining land values on a widespread basis.
Regional Land Market Developments
Market developments in the first three quarters of 2008 reflected buyers’ continuing resistance to escalated asking prices (see Figures 4 and 5). This resistance appeared more pronounced for larger livestock properties early on as high feed prices squeezed returns. As the year progressed and economic troubles mounted, demand for recreational acreage began to cool.


Anecdotal evidence suggests that the supply of land for sale has begun to increase. Cropland markets in the Panhandle have boomed. Areas with feverish mineral production activity have also experienced increased demand. However, some local markets appear poised to take a breather from the rapid escalation of prices seen in recent years. These factors point to a muted 2008 rise in already historically high land prices.
Proper Use of Data
The tables included in this analysis contain statistics based on regional medians of prices paid for rural lands in Texas. Approximately 8,000 reported transactions form the foundation for this analysis of general trends in Texas land markets.
The median is the middle price in a ranked list of prices. Each individual Land Market Area listing in the tables relates to the median sale prices for the indicated region. Because medians are not unduly influenced by extremely high or low prices (outliers), these medians provide a stable indicator of typical properties over time using relatively small samples of sold properties.
The statewide trend analysis reflects changes in weighted average of regional median land prices. The weighting process reflects the percentage of Texas rural land found in each land market area as well as each regional median price.
Readers should use the statistics from the tables as an indicator of past general trends in prices in Texas land markets. The data are highly aggregated and do not represent land prices or values of any particular farm, ranch or tract. However, the statistics do provide a general guide to land market developments. Readers should not regard the reported statistics as a substitute for an appraisal or market study of current local sales regarding the value of any particular farm or ranch.


